
In the third quarter, markets scaled the proverbial “wall of worry,” brushing aside tariff concerns thanks to strong corporate earnings, surging AI enthusiasm, and the early signs of a Federal Reserve easing cycle. The approval of new trade agreements and the passage of the “One Big Beautiful Bill” alleviated several lingering uncertainties, though not all. While inflation edged upward, it stayed below the anticipated post–Liberation Day surge, allowing the Fed to cut rates at its September meeting amid sharply deteriorating jobs data. As financial conditions and business confidence improved, leveraged buyout activity picked up momentum, highlighted by a strong rebound in major private equity transactions across the technology and consumer sectors.
The quarter delivered a mix of conflicting signals: unemployment climbed to its highest level since 2021 as job growth slowed to a crawl, yet U.S. equity markets soared to record highs and corporate credit spreads narrowed to levels not seen since the late 1990s. While recession fears have eased, consumer sentiment remains cautious and uneven.
As 2025 winds down, investor attention will center on corporate earnings reports for signals around AI-related capital spending, consumer resilience, and how companies are managing tariffs. The fourth quarter also features two pivotal Fed meetings, where evolving guidance on inflation and labor market conditions could shape the path forward for monetary policy. The Fed is grappling with a disconnect between economic growth and labor market trends, a departure from historical cycles, as investors navigate lofty valuations and shifting market dynamics driven by rapid innovation.
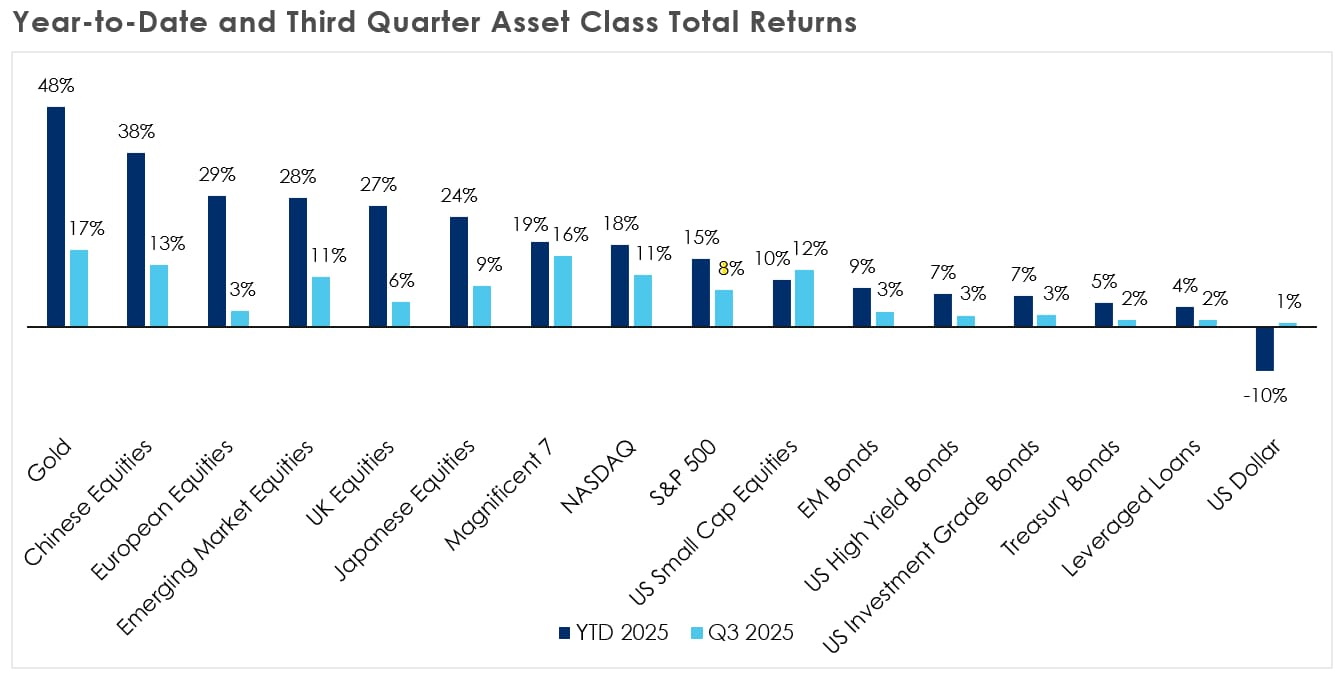
Source: Bloomberg as of September 30, 2025. All indices are measured in USD. Magnificent 7 = UBS Magnificent 7 Index; NASDAQ = NASDAQ Index; S&P 500 = S&P 500 Index; Japanese Equities = Nikkei 225 Index; European Equities = Stoxx 600 Index; US Small Cap Equities = Russell 2000 Index; US High Yield Bonds = Bloomberg US Corporate High Yield Total Return Index; Leveraged Loans = Bloomberg US Leveraged Loan Index; Gold = Gold Spot Price; Oil = Oil Spot Price; US Dollar = U.S. Dollar Index; Emerging Market Equities = MSCI Emerging Markets Index; Emerging Market Bonds = Bloomberg Emerging Markets Aggregate Bond Index; US Investment Grade Bonds = Bloomberg U.S. Corporate Investment Grade Index; Treasury Bonds = Bloomberg US Treasury Total Return Index; Chinese Equities = Hang Seng Index; UK Equities = FTSE 100 Index
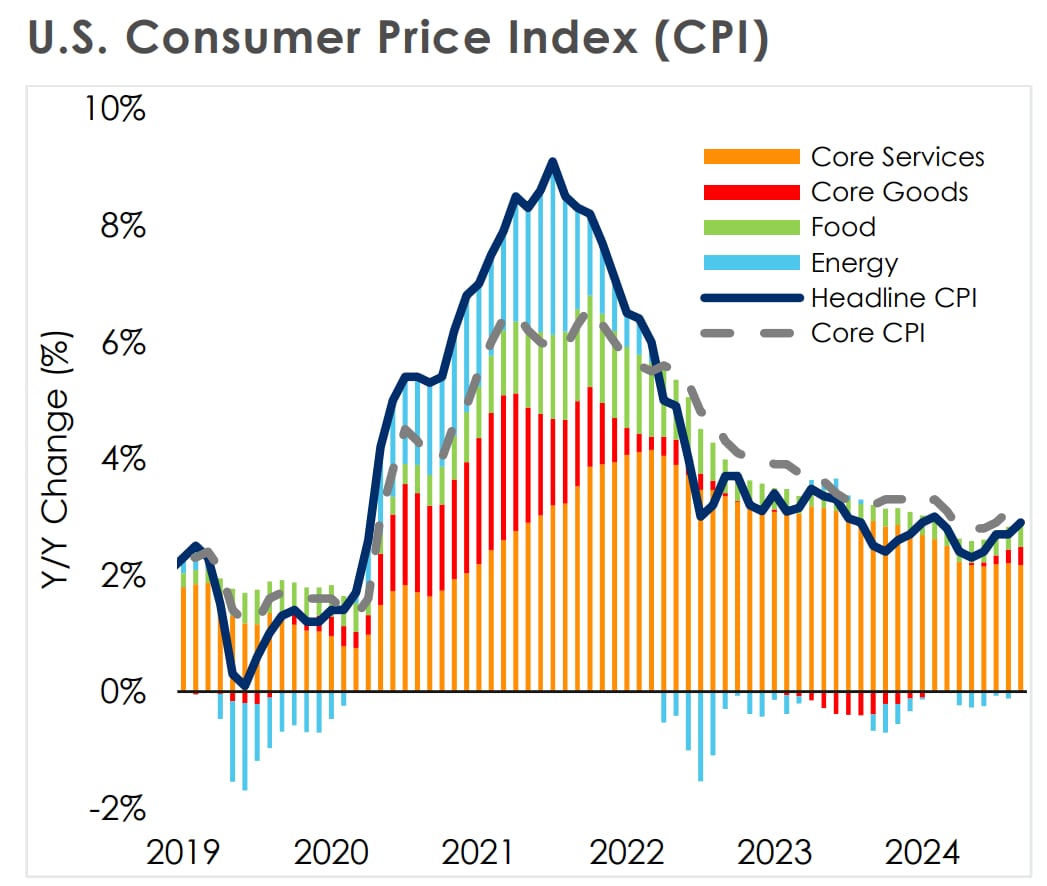
In hindsight, Fed policy decisions might seem straightforward: when inflation risks outweigh growth and employment concerns, raise policy rates; when growth and employment are at greater risk, lower them. Simple, right? After Covid, rampant inflation, characterized by CPI peaking at over 9 percent year-over-year in 2022, was the dominant threat, leading to a series of rate hikes. Simple.
In the first half of the year, on one hand, tariffs and fears of a trade war threatened to exacerbate already persistent inflation. On the other hand, as of June 30, the labor market showed apparent resilience with average monthly job growth hovering around 130,000, and the ratio of job openings to unemployed workers in balance. These factors prompted the Fed to maintain relatively high, or restrictive, interest rates. Simple?
Well, maybe the jury is still out. In hindsight, the anticipated inflationary impact from tariffs has unfolded more slowly than expected. Recent CPI data indicate headline and core inflation rose year-over-year to 2.9 percent and 3.1 percent, respectively, but tariffs have not been the main story. Instead, the services sector — driven by shelter, medical care, and transportation, all linked to an aging, affluent population — remains the primary driver, contributing 2.7 percent to core CPI compared to just 0.4 percent from the goods sector. Acknowledging, however, that the service sector’s contribution has declined from 3.3 percent in January thanks to falling rents, while the goods sector has shifted from a slight deflation of -0.02 percent in January to mild inflation today.
Source: Bloomberg as of September 30, 2025.
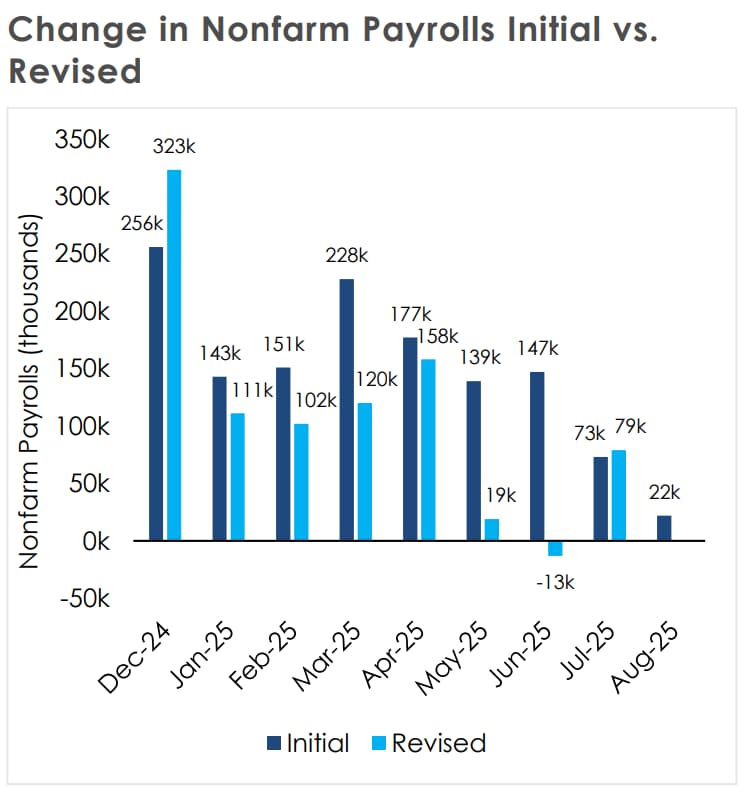
On the labor front, in hindsight, the jobs market’s strength may have been a mirage. The Bureau of Labor Statistics issued the largest downward revision on record, reducing estimates by 911,000 jobs from April 2024 to March 2025. Survey-based rolling revisions further revealed that nonfarm payrolls were actually 125,000 lower in May and 160,000 lower in June than understood on June 30th. With July and August’s figures considered, average monthly job growth over the past four months has dropped to just 26,750. A portion of the labor market weakness appears structural, primarily stemming from reduced immigration, though measuring the full impact remains difficult. At the same time, cyclical factors are evident, with hiring notably subdued and concentrated in resilient sectors such as education and healthcare.
Source: Bloomberg as of September 30, 2025.
Ultimately, policymakers must navigate in real time, not with the benefit of hindsight. They contend with delayed effects from policy changes, rely on flawed historical data, and face the challenges of evolving fiscal policies. These complexities amid an evolving economy underscore just how difficult it is to make sound policy decisions and maintain effective positioning.
The September Shift
While the prospect of further inflationary pressure from tariffs remains on the horizon, a weak labor market is undeniable. Job growth is anemic, labor force participation remains subdued at roughly 62.3 percent, initial jobless claims are trending, and continuing claims are elevated. In aggregate, this paints a picture of an economy with low hiring, low firing, and longer spells of unemployment.
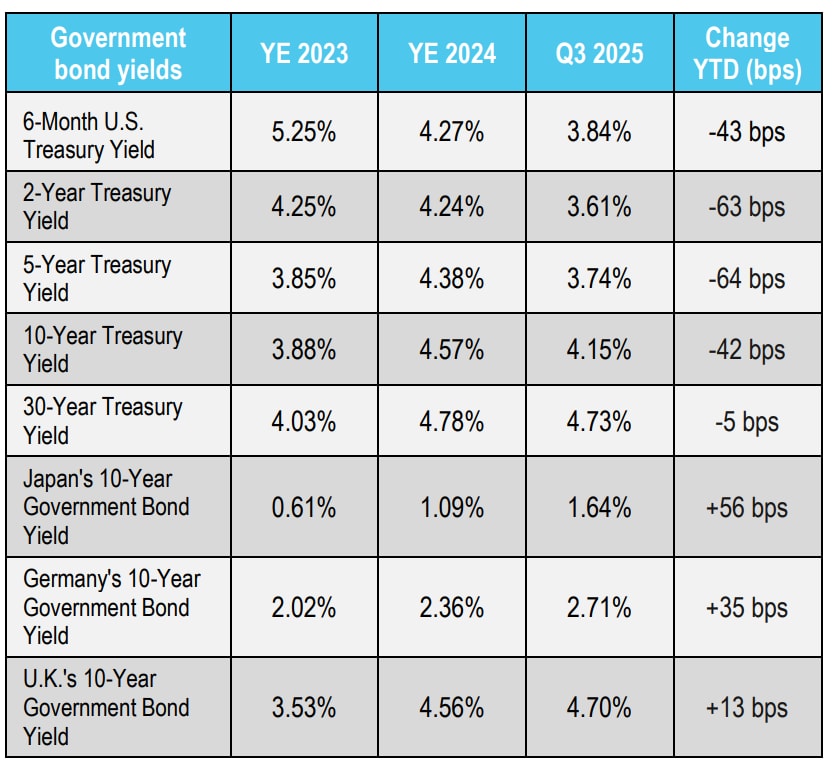
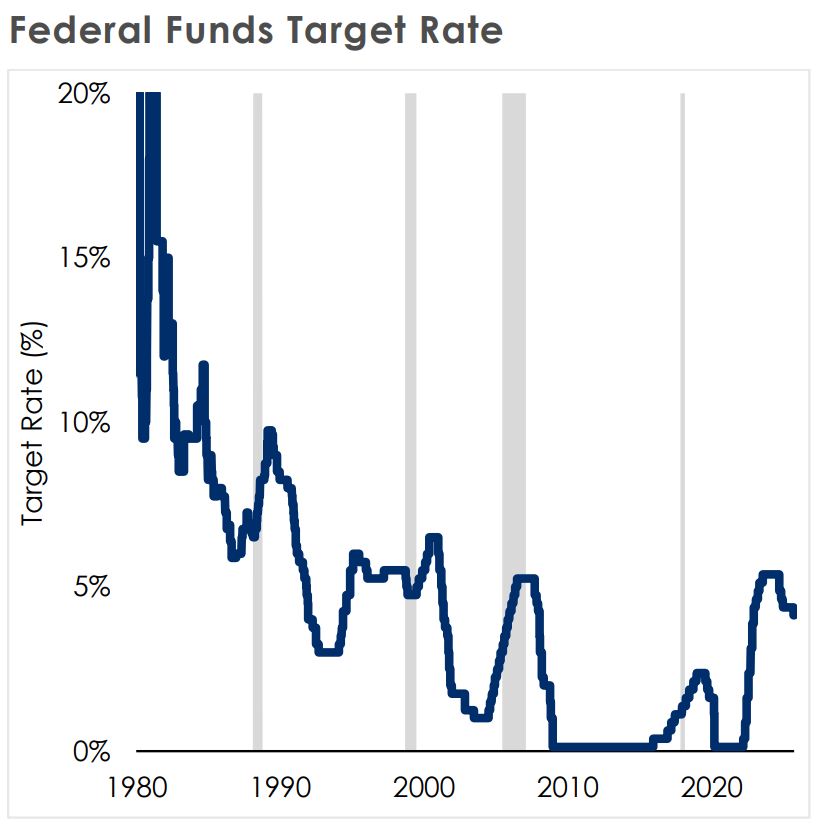
These developments shifted the consensus and urged policy reassessment reflected in the Fed’s decision to resume the easing cycle in September, cutting the policy rate by 25 basis points.
Source: Bloomberg as of September 30, 2025.
The updated Summary of Economic Projections (“dot plot”) reinforced this dovish pivot. The median Federal Open Market Committee (“FOMC”) participant now anticipates two additional rate cuts by year-end, with the policy rate projected to end 2025 in the 3.50 percent–3.75 percent range, and one more rate cut in 2026. Meanwhile, the market is pricing in a steeper path of rate cuts with four 25-bps cuts by the end of 2026 versus the Fed’s median projection for three cuts total. The range of FOMC projections has also widened, underscoring their uncertainty about both the inflation trajectory, the true state of the labor market, and changing composition of the FOMC itself.
Source: Bloomberg as of September 30, 2025.
Importantly, this policy shift should not be viewed as a definitive pivot from restrictive to accommodative policy. Rather, it reflects an acknowledgment of a more fragile balance of risks. Chair Powell emphasized this nuance in his post-meeting remarks, describing the move as a “risk-management cut” intended to keep policy aligned with evolving risks.
For now, the Fed’s dovish tilt is acting as a tailwind for equities and risk assets, while also cushioning the blow of a sluggish labor market that continues to show signs of strain. With the final quarter underway and 2026 on the horizon, the Fed and market participants are attuned to fresh economic indicators that may reveal either cracks or resilience, potentially influencing the next policy move. The ongoing government shutdown and lack of economic data have made the current environment even more difficult to interpret.
Equities: Concentrated Indices, Concentrated Ownership
Despite a precarious macroeconomic backdrop, U.S. equity markets, as proxied by the S&P500, have surged to new all-time highs, returning 14.8 percent year-to-date and 35.1 percent from the April trough. This rally reflects not only the Fed’s dovish pivot, but also the combined effects of expected deregulation, accommodative fiscal policy, resilient aggregate consumption, and, most notably, the ongoing AI investment boom.
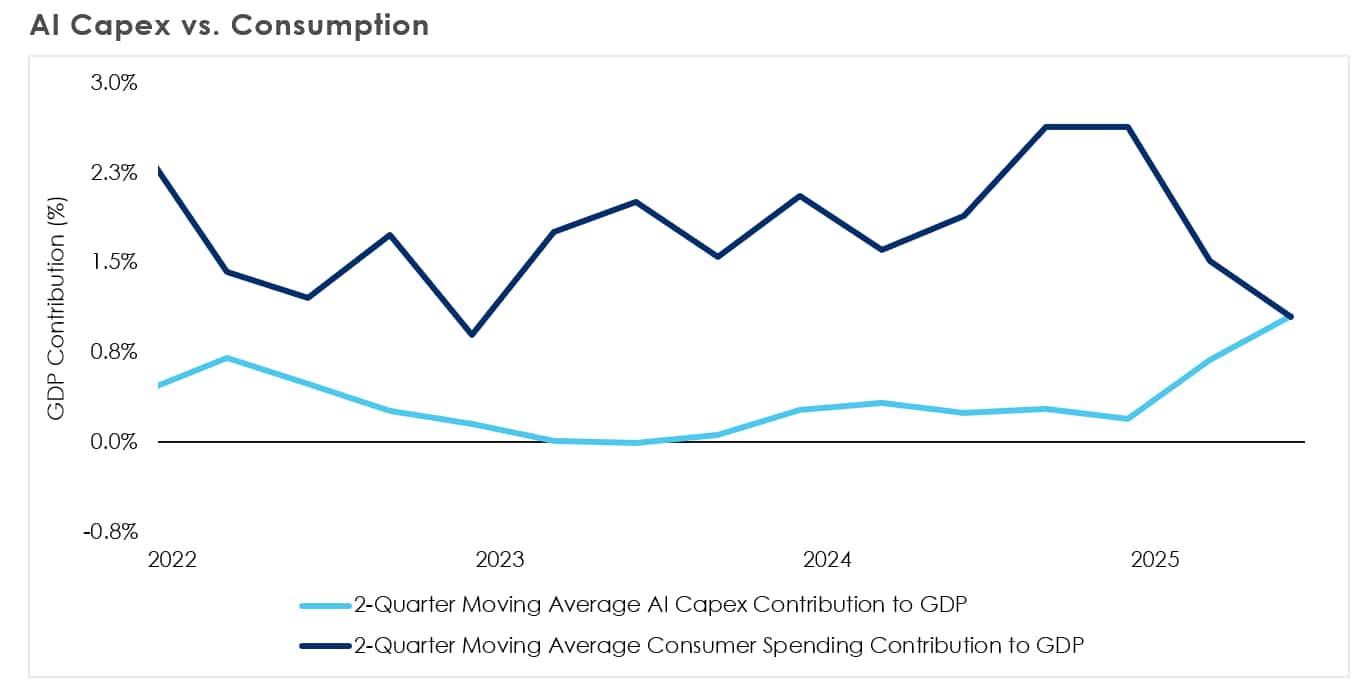
Following the “Liberation Day” tariff announcements, markets initially discounted earnings expectations, anticipating a pullback in consumption and investment. Yet, second quarter earnings proved resilient, exceeding pre-tariff levels. Market leadership remains highly concentrated: the Magnificent 7 — Nvidia, Microsoft, Apple, Alphabet, Meta, and Tesla — now comprise roughly 35 percent of S&P 500 market capitalization, with performance driven by an AI arms race that has propelled capex spending in-line with consumer spending as a GDP driver, a notable shift from historical norms.
Source: Bloomberg as of September 30, 2025
This capex cycle is self-reinforcing. Spending by firms like Meta and Alphabet translates directly into revenue for Nvidia, creating a positive short-term earnings feedback loop. While capex is capitalized and spread over time, revenue is recognized immediately, amplifying near-term aggregate earnings. However, this dynamic is expected to fade as anticipated year-over-year EPS growth for the Magnificent 7 converges with the rest of the index by 2026.
The current equity market composition and ownership concentration introduce skewed risks. The wealthiest 10 percent of households, those earning $250,000 or more annually, are responsible for roughly half of all consumer spending and hold about 70 percent of the nation’s wealth. Should AI adoption or innovation lose momentum or evolve contrary to investor expectations, the market may undergo a notable correction driven by a reassessment of future assumptions. While the risks to consumption may not perfectly mirror shocks in the equity market, the negative wealth effect could still prompt reductions in discretionary spending, potentially triggering a feedback loop, further weighing on equity prices and broader economic activity.
Beyond the Magnificent 7
Market momentum has not been confined to the behemoths of the technology sector. Anticipated deregulation has supported sectors less exposed to tariffs, such as Financials, while fiscal stimulus, from the One Big Beautiful Bill, has reduced corporate tax payments, in large part offsetting year-to-date tariff collections. For the upper half of the income distribution, the net impact of tax cuts and tariffs has been largely neutral, sustaining wealth effects and discretionary spending. These forces, alongside near-term expectations of a more dovish Fed, drove the more interest rate and macroeconomic sensitive Russell 2000 above previous 2021 all-time highs as the index has returned approximately 10.4 percent through September 30th.
Global equities continue to outperform the U.S. on a year-to-date basis, with the S&P 500 experiencing a total return of about 14.8 percent. In comparison, measured in USD, total returns have been approximately 27.5 percent for MSCI Europe, 25.1 percent for MSCI EAFE, and 27.5 percent for MSCI Emerging Markets. Broadly, global equity performance has been supported by more attractive starting valuations abroad, fresh fiscal stimulus, supportive monetary policy and sectoral leadership—energy and industrials in Europe and technology and financials in Asia. Yet the most important catalyst for global equity gains has been the U.S. dollar’s weakness. The DXY dollar index has fallen roughly 10 percent year-to-date, meaning each unit of local-currency returns translates into a larger gain when measured in dollars.
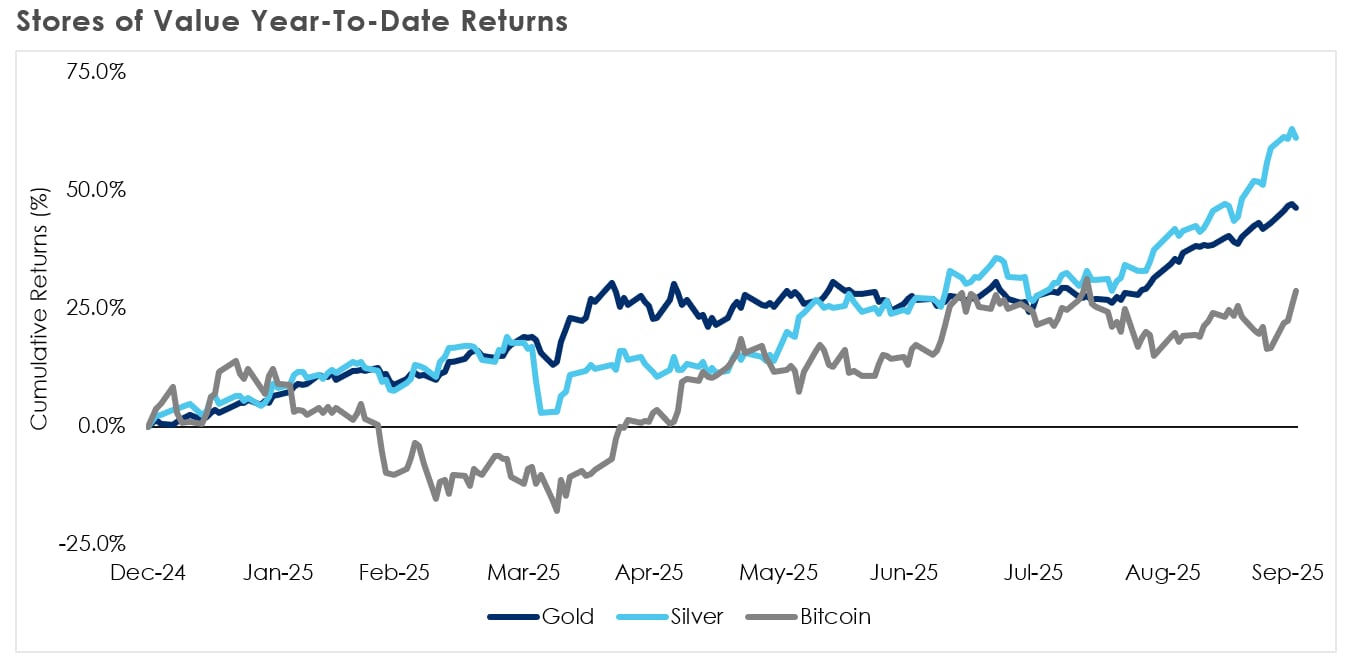
Persistent inflation pressures, soaring public debt that raises the specter of future money-printing, increased hedging activity, and escalating geopolitical tensions have all weighed on the U.S. dollar. As confidence in, and thus value of, fiat money wanes due to these headwinds, traditional stores of value such as gold and silver—along with newer alternatives like Bitcoin—have seen increased demand. Central banks and investors, willing to accept the opportunity cost of zero yields, now view precious metals and cryptocurrencies as a safeguard against potential capital losses stemming from geopolitical tensions or monetary debasement. This monetary imprudence hedge has propelled gold, silver, and Bitcoin to or near all-time highs: year-to-date through September, gold surged approximately 46.8 percent, silver soared 60.9 percent, and Bitcoin advanced 22.3 percent.
Source: Bloomberg as of September 30, 2025
Stable Credit Health
Alongside robust equity markets, credit market health remains constant. Technical factors, particularly persistent demand for yield, have kept credit spreads, a measure of risk or stress in debt markets, tight. But solid fundamentals, reinforced by resilient second quarter earnings, are equally important. Since the depths of April pessimism, investment grade and high yield spreads have tightened by approximately 45 and 185 basis points, respectively. As of September 30, Investment grade credit spreads sit just below 75 basis points, among the tightest since the late 1990s and well below the historical average of 146 basis points. High yield spreads have compressed to around 265 basis points, compared to a long-term average of 510 basis points.
Low net supply, or gross issuance less maturities and called bonds, is a key technical driver. For example, according to JPMorgan, investment grade bond net supply in 2025 is nearly 25 percent lower than in 2024. But Barclays estimates that coupon reinvestment will account for roughly two-thirds of net supply this year, the highest share since 2019, leaving nominal net supply after coupons at just $210 billion. In other words, most new bonds are simply being bought by investors reinvesting their interest payments, limiting absorption needs, keeping spreads tight, and dampening volatility.
Conclusion: All Eyes on AI
As we look ahead through policy recalibration, labor market ambiguity, and resilient risk assets, one theme is evident: artificial intelligence is no longer a speculative tailwind, it is now the central axis of the economic and market outlook.
In the labor market, AI’s rapid adoption is already reshaping the landscape. Unemployment among young workers and recent graduates has surpassed the overall rate, suggesting that entry-level job availability is dwindling as firms pause hiring to assess productivity gains. For now, this is less about outright job displacement and more about a drag on job creation.
According to JP Morgan, since ChatGPT launched in November 2022, AI related stocks have accounted for 75 percent of S&P 500 returns, 80 percent of earnings growth and 90 percent of capital spending growth. Announcements of AI investment alone have driven outsized moves in valuations. For example, Nvidia’s $5 billion stake in Intel and $100 billion OpenAI investment plan led to a $320 billion market value boost, triple the expected spend, in just three trading days. Similarly, Oracle’s stock jumped 25 percent on the promise of $60 billion a year from OpenAI, an amount of money OpenAI doesn’t earn yet, to provide cloud computing facilities that Oracle hasn’t built yet.
From a macro perspective, the hope is that AI-driven productivity gains will eventually expand the economy’s supply side, easing inflationary pressures and supporting real wage growth. In the most optimistic scenario, this innovation cycle could help “grow our way out” of fiscal constraints and debt overhangs.
Key things to watch:
• The short-term interplay between low or negative net migration and AI technology. A larger labor force is typically desirable for growth, but AI, which threatens to displace jobs, makes a smaller workforce more efficient.
• Over the long run, whether transformative technologies will create new forms of employment, and how the timing and magnitude of this shift will play out, especially amid uncertain re-migration trends.
• Continued short-term announcements and global developments, from semiconductor demand to new entrants.
• Third quarter earnings results and management outlooks on AI capex spend, emerging AI innovations, new tax and trade policies, and an ever-evolving economic backdrop.
• Whether long-run outcomes of capex investment will justify today’s lofty valuations, or if we are witnessing a market bubble fueled by corporate “keeping up with the Joneses.”
• Signs that higher productivity and growth are translating into stronger tax receipts and a more manageable debt trajectory, or if fiscal pressures persist despite technological progress.
We look forward to reviewing the fourth quarter with you early next year.
____________________________________