
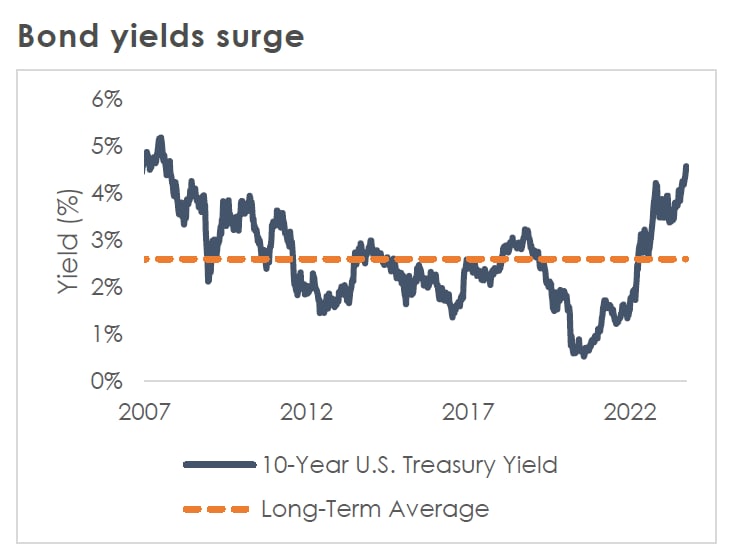
The third quarter began with buoyant equity markets as investors became more confident in a soft-landing scenario for the U.S. economy, encouraged by a “goldilocks” backdrop of disinflation, and moderating, but not plummeting, economic growth. However, after returning over 20 percent through the end of July, the S&P 500 posted consecutive declines in August and September as interest rates took yet another leg higher and the Federal Reserve left the door open for a fourth quarter interest rate hike after hiking the Fed funds rate to 5.25 percent-5.50 percent in July. Thirty-year mortgage rates hit their highest level since 2000, and the 10-year Treasury yield rose to over 4.6 percent, its highest level since 2007.
“Higher for longer” and “higher from here” interest rates have unnerved market participants who are contemplating how a persistently higher cost of capital and more restrictive financial conditions will impact companies, consumers, and governments. Thus far, the economy has weathered higher interest rates well, resulting in a feedback loop that has emboldened the Fed to tighten aggressively. Inflation is trending in the right direction, but core inflation still stands at over 4 percent, well above the Fed’s 2 percent target.
Oil prices recently surged to their highest levels since late 2022, complicating the Fed’s efforts to bring down inflation and creating a headwind to consumers who have mostly exhausted pandemic savings and many of whom have resumed student loan repayments after a three-year hiatus. Finally, the third quarter saw Fitch downgrade the credit rating of the U.S. to AA+ from AAA, citing the expected fiscal deterioration over the next three years, a high and growing general government debt burden, and the erosion of governance relative to 'AA' and 'AAA' rated peers over the last two decades that has manifested in repeated debt limit standoffs and last-minute resolutions (like the averted government shutdown on September 30th). Compounding structural inflation pressures like a shrinking labor force and mounting geopolitical tensions, U.S. deficit spending and debt levels have been cited as yet more reasons we could see “higher for longer” interest rates.

 Source: Bloomberg as of Sept. 30, 2023.
U.S. economy swims against the recession tide
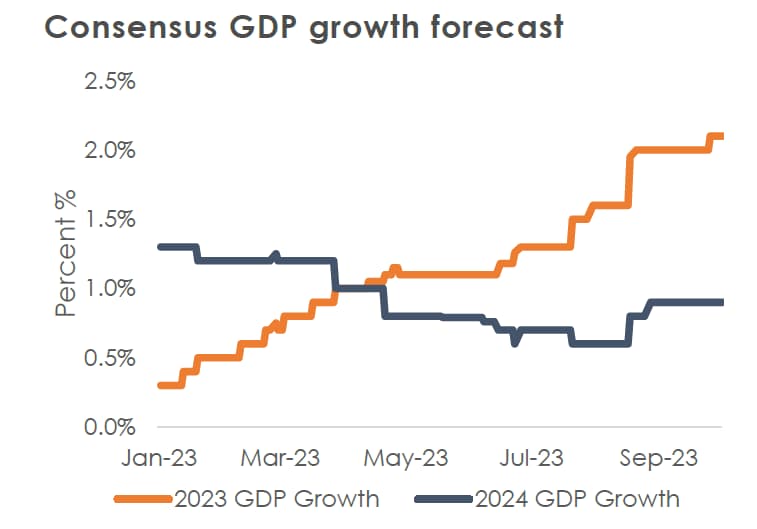
Going into 2023, the U.S. economy was expected to grow less than 0.5 percent; however, GDP growth has outperformed this year on the back of resilient consumer spending and labor markets. Even with substantially higher interest rates, the U.S. economy is expected to grow at a respectable 2.1 percent clip in 2023. Key to the outlook for the U.S. economy is jobs. The economy continues to add jobs, but at a slowing pace, particularly in more economically sensitive sectors. Fewer people are quitting their jobs, and job openings have fallen to their lowest levels since 2021, indicating a more balanced labor market. There has also been an encouraging uptick in labor force participation to its highest levels since before the pandemic. Easing of labor market tightness without job losses is indicative of a “soft landing” and exactly what the Fed wants to see, but whether the labor market (and economy) will maintain a steady glidepath of slowing, but not stalling growth, is a question both the Fed and investors alike are wondering.
Source: Bloomberg as of Sept. 30, 2023.
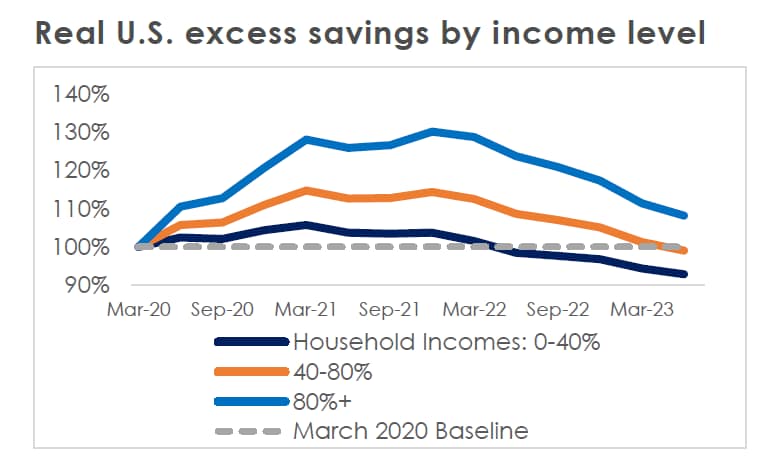
Consumer resilience has also been driven by pandemic savings and “YOLO (You Only Live Once)” spending. Unfortunately, most Americans outside the wealthiest 20 percent of the country have run out of pandemic savings, with less cash on hand now than when the pandemic began, according to a recent Federal Reserve study of household finances.1 With student loan payments resuming in October, impacting over 43 million people (according to the U.S. Department of Education), pandemic savings depleted for middle- and lower-income households, and gas prices at the pump on the rise again, the U.S. consumer is facing several challenges. Credit card losses are rising at the fastest pace since the Great Financial Crisis with Americans owing more than $1 trillion in credit card debt, a record high.
Source: Bloomberg as of Sept. 30, 2023.
Housing affordability worsens with spike in mortgage rates
According to Goldman Sachs, three years ago, a 30-year mortgage cost 2.9 percent and a median home in the U.S. cost $310,000. Today the average 30-year mortgage is approximately 7.7 percent, and the median house price is $407,000. The spread between median home price and median income continues to widen as median income has increased from $65,000 in 2020 to $78,000 in 2023. Housing affordability is at its most unfavorable on record, with a home buyer's typical monthly housing-cost-to-income ratio at a burdensome 45.5 percent compared to a historic average of 33 percent, per John Burns Research.
Housing turnover is also very low. Homeowners are unwilling to give up the historically low mortgage rates they locked in when interest rates were much lower, pushing buyers into the new housing market. Housing prices have moderated but remain supported by a dearth of inventory. On the positive side, rent growth is cooling back to pre-pandemic norms as apartment supply has increased significantly. Declining rent growth is another welcome sign for the Fed as it is also contributing to overall disinflation.
Checking in on Corporate America
U.S. equities gave up a good portion of their 2023 gains in the third quarter. The S&P 500, Nasdaq, and Russell 2000 were down 3.65 percent, 4.12 percent, and 5.49 percent, respectively. Technology’s impact on the overall market was mixed as Apple stood out as a laggard during the quarter and NVIDIA’s pace of gains slowed after the stock price more than doubled in the first half of the year. Still, as of the end of the third quarter, seven companies (Facebook/Meta, Apple, Amazon, Google/Alphabet, Microsoft, NVIDIA, and Tesla) account for almost 99 percent of the S&P 500’s gains in 2023 with the other 493 companies together posting a price return of 0.12 percent this year.
AI or Artificial Intelligence remains a prominent theme; 177 companies cited the term “AI” during their earnings call for the second quarter. This number is well above the 5-year average of 60 and the 10-year average of 37. In fact, this is the highest number of S&P 500 companies citing “AI” on earnings calls going back to at least 2010.
AI continues to be a cause for excitement given its incredible productivity potential, and at a time when capital spending might be under pressure due to weaker earnings growth, many companies are choosing to invest in AI and in equipping their employees with AI capabilities.
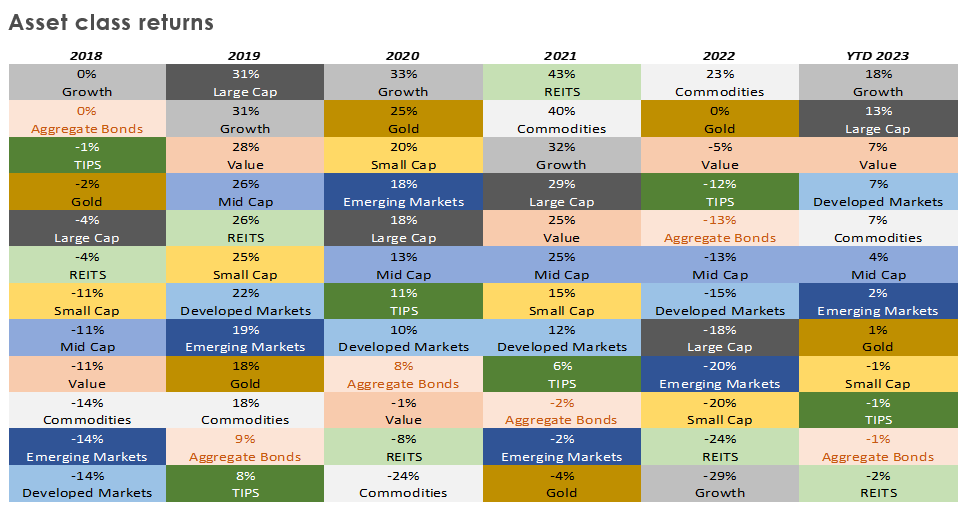
Source: Bloomberg as of Sept. 30, 2023. Growth = S&P 500 Growth Index; Large Cap = S&P 500 Index; Value = S&P 900 Value Index; Developed Markets = FTSE Developed All Cap Excluding United States Index; Commodities = S&P GSCI Total Return Index; Small Cap = Russell 2000 Index; Mid Cap = S&P Midcap 400 Index; Emerging Markets = MSCI Emerging Markets Index; Gold = Gold Spot Price; TIPS = Bloomberg Global Inflation-Linked: U.S. TIPS Total Return Index; Aggregate Bonds = Bloomberg U.S. Aggregate Index; REITS = MSCI US REIT Index
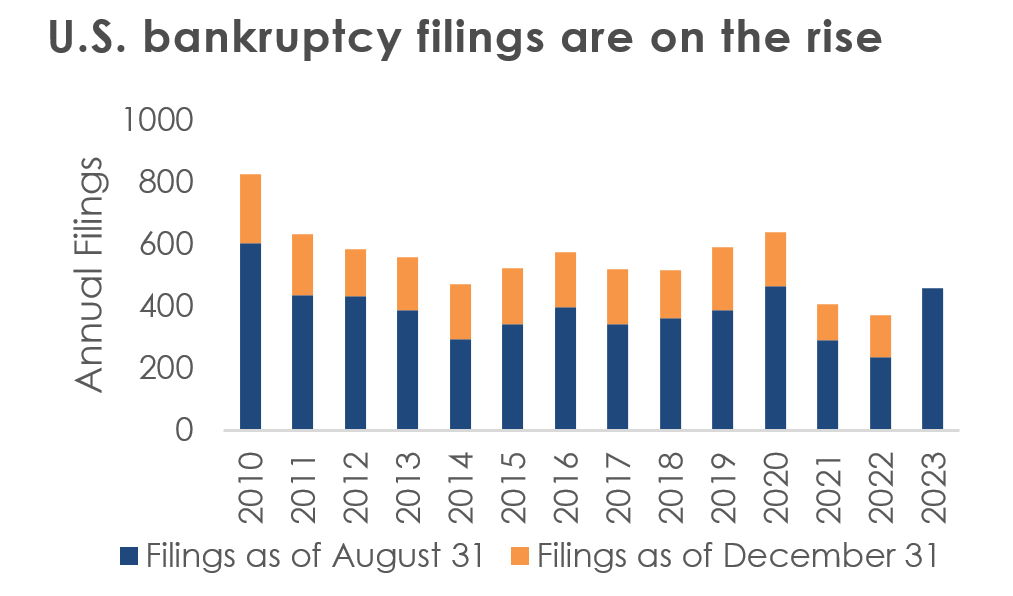
As mentioned above, the Russell 2000, a barometer for smaller companies, underperformed in the third quarter. While few major corporations have filed for bankruptcy this year, the total number of Chapter 11 bankruptcy petitions filed rose by 54 percent year-over-year in August, according to Bloomberg. S&P Global Market Intelligence recorded 459 bankruptcy filings in 2023 as of Aug. 31, more than the full-year totals for 2021 and 2022. Small-business loan delinquencies and defaults have risen since June 2022 and are now above pre-pandemic averages, according to Equifax.
Source: S&P Market Intelligence as of August 31, 2023
Alongside interest rates, earnings are one of the core drivers of equity returns. For the third quarter, the estimated (year-over-year) earnings decline for the S&P 500 is -0.2 percent. If -0.2 percent is the actual decline for the quarter, it will mark the fourth straight quarter of (year-over-year) earnings declines reported by the index. However, the estimated decrease in earnings for the third quarter would be the smallest decline during this four-quarter period. At present, earnings are challenged by a number of headwinds, including a large uptick in labor strikes and the associated costs. On balance, corporate messaging remains relatively upbeat ahead of third quarter earnings season, and we are even seeing positive earnings revisions.
Hawkish Fed, heavy national debt, higher interest rates
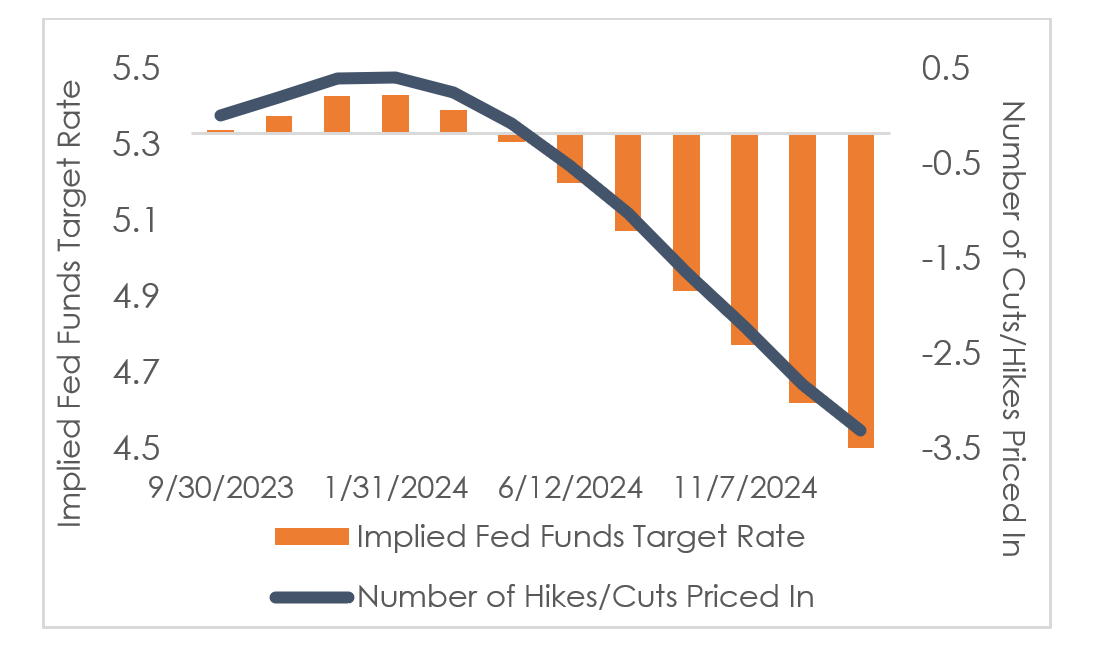
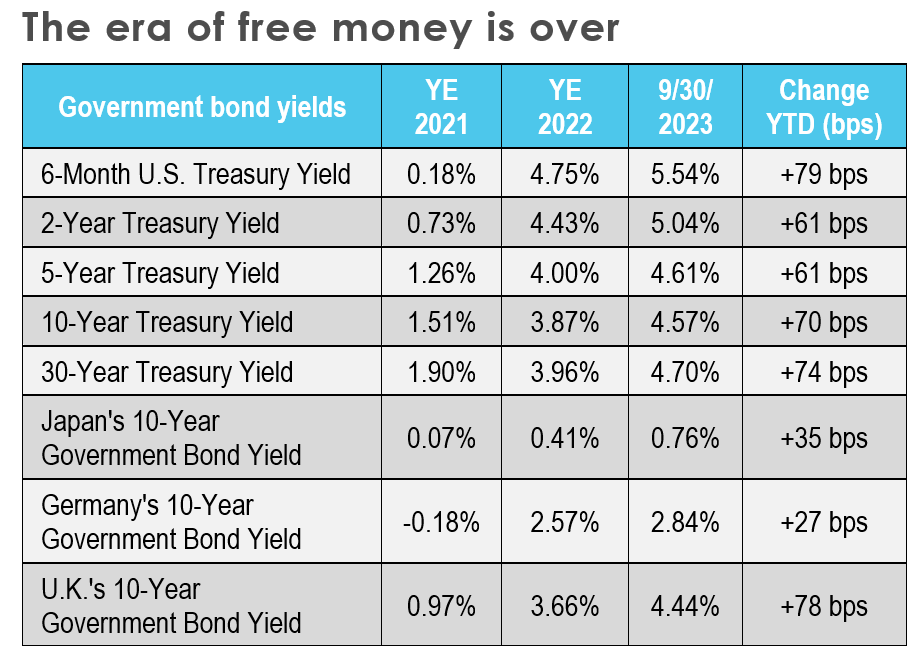
The path of least resistance for Treasury yields has been to the upside due to several factors including better-than-expected economic data, a Fed laser-focused on bringing down inflation, and record U.S. government debt and deficits. In July, the Fed raised its benchmark rate in July to a range of 5.25 percent to 5.50 percent, a 22-year high, and at its September meeting, penciled in another hike for 2023 and projected that short-term rates would remain above 5 percent through 2024. The market is less convinced, pricing in that the Fed has reached the peak of its hiking cycle.
Source: Bloomberg as of Sept. 30, 2023.
Another likely contributor to higher Treasury yields is persistently rising debt issuance to finance U.S. government deficit spending and rising U.S. national debt. This increased government borrowing comes at a time when the Fed is shrinking its holdings of Treasurys, meaning other buyers will have to absorb increased issuance. The U.S. is also paying a record amount of interest on its national debt. Debt service costs rose 25 percent in the first nine months of the fiscal year to $652 billion.
Looking ahead
As we look to the fourth quarter and to 2024, the debate over recession remains front and center. We are encouraged by how well the U.S. economy has performed thus far with such a rapid increase in interest rates. Corporate profits have held up very well, only posting modest declines. The current backdrop looks a lot like a “soft landing”. Higher Treasury yields have been a recent headwind for equity markets, but they are making fixed income investments even more attractive. A few years ago, it was hard to imagine an investor would be able to earn 5 percent on short-term Treasurys (cash) and high single digit yields on corporate debt.
Source: Bloomberg as of Sept. 30, 2023.
2023 has been a prime example for how difficult it is to accurately make short-term market and economic predictions. The economy has been much stronger-than-expected. There has not been a recession, and the Fed has increased interest rates more aggressively than expected. Years like this make it very clear why it is important to take a long-term view and avoid trying to time the market. We do not know the timing of the next recession, the first Fed interest rate cut, or the equity market’s next bottom. However, we can look collectively at the current environment, risks to the downside, risks to the upside and think about investment positioning within a range of scenarios.
While we are likely headed for slower growth and possibly recession, there are many opportunities in the current environment, especially in fixed income. Furthermore, U.S. equities have exhibited long-term staying power through many crises despite a lot of volatility. According to Goldman Sachs, since the worst moment of the Long-Term Capital Management crisis in September of 1998, the S&P 500 has returned +538 percent (including dividends) even including the Global Financial Crisis and COVID. We recommend speaking with a financial professional to assist you in navigating this complex environment.
_______________________________