| ||||||||||||

“In ancient times cats were worshipped as gods; they have not forgotten this. I sometimes watch my cat do something incredibly stupid, and then I realize I’m the one watching a cat do something incredibly stupid.”
— Terry Pratchett, English author, humorist, satirist
“The housing market is the only place where you can pay a million dollars for something and still need to fix the roof.”
— Unknown
What a world we find ourselves in right now. Unprecedented policy changes, a 12-day war that may turn out to be longer than 12 days, tariffs not seen since the 1970s, falling inflation after remarkably high inflation, a tax plan that is pro-growth but will massively increase the U.S. debt load, a struggling consumer and, yet, markets that are, as of the time of this writing, up a tad for the year. Perhaps even more shocking is that a team from Oklahoma won the NBA Championship … what, I dare ask, is this world coming to?
So, while we could have covered the military conflict, the tax plan, the tariffs, and every other topic which requires deep thought (of which there are many right now) … I decided to concentrate on that which is solid, that which is foundational and, candidly, that which is the largest asset most Americans possess: their home.
With that, let us begin…
Mi Casa, Su Casa
If you zoom out for a moment, the U.S. housing market accounts for roughly 15 percent of U.S. gross domestic product (GDP), and is roughly valued at around $4.5 trillion, with roughly 146 million housing units of some sort.
In short, it’s massive. Perhaps more important, housing is culturally vital. Housing, and the associated incentives around it (including a government supported mortgage system), very much value the idea of owning a home … in fact, it’s quite literally part and parcel with the American Dream.
And, for many Americans (~65 percent of the population owns a home), it is quite literally the largest asset they own. As such, when home prices go up, the perceived level of wealth rises in this country, and when home prices go down, the perceived level of wealth declines. As such, it matters.
So, my dear readers will say, “get to the point! Is it going up or down?”
Which brings me to the first chart.
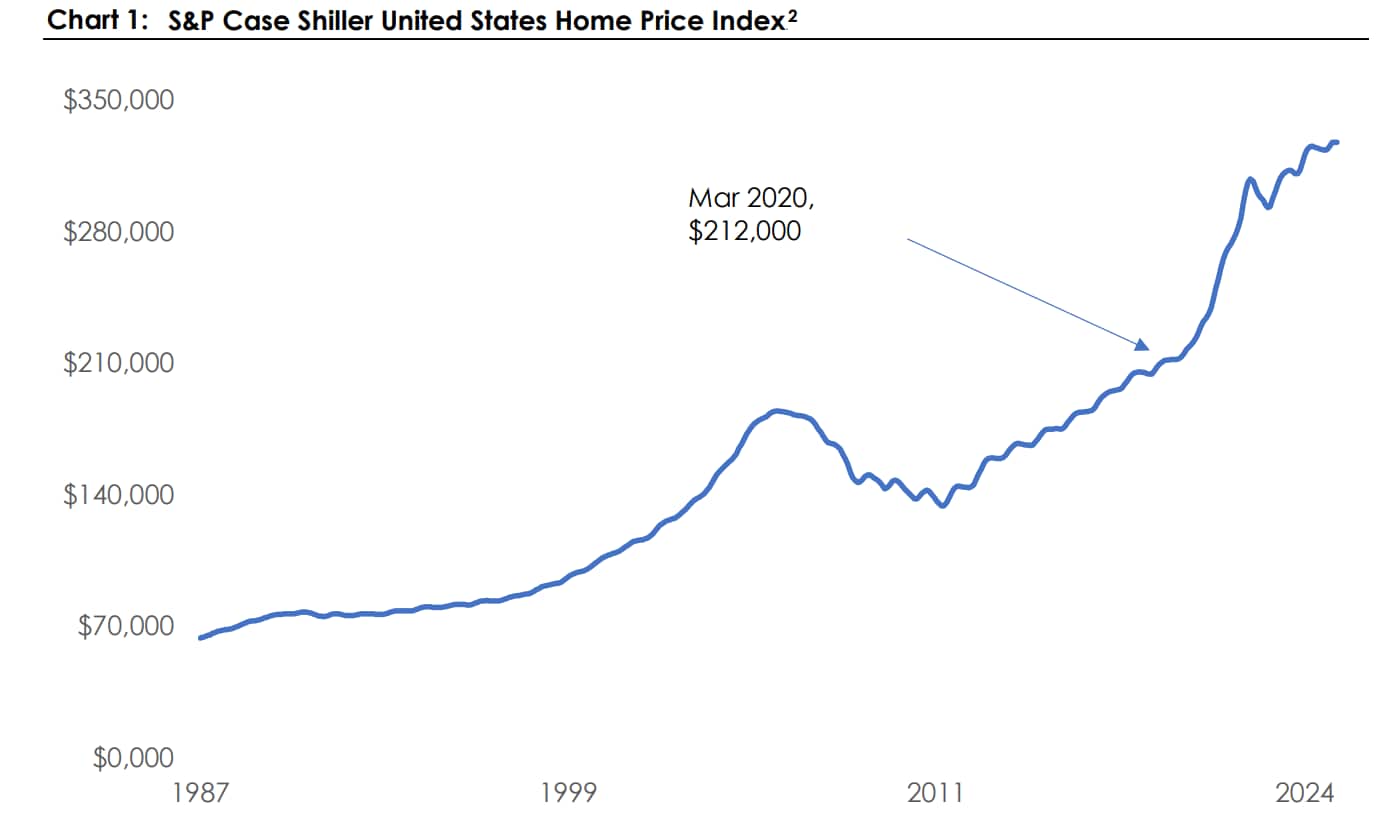
While not a perfect representation, the Case-Shiller index is one of the more useful housing indices, providing a sense of how home prices are changing. While the process of calculation is a bit complex, the index relies on repeat sales of the same single-family homes over time, and has been a fairly good representation of the average American homeowner experience.
And, as the chart makes abundantly clear, home prices have been rising for a long period of time (as they should given inflation), but made a particularly strong move during (and after) COVID changed how Americans thought of housing. More specifically, the average home in March 2020 was around $212,000, and is now $327,680 … roughly a 55 percent increase in five years.
So, to answer the first question – yes, home prices have gone up.
But wait, there’s more! What about mortgages? We are, after all, a populace that loves credit and, given that most home purchases are fueled by a mortgage, let’s take a look there.
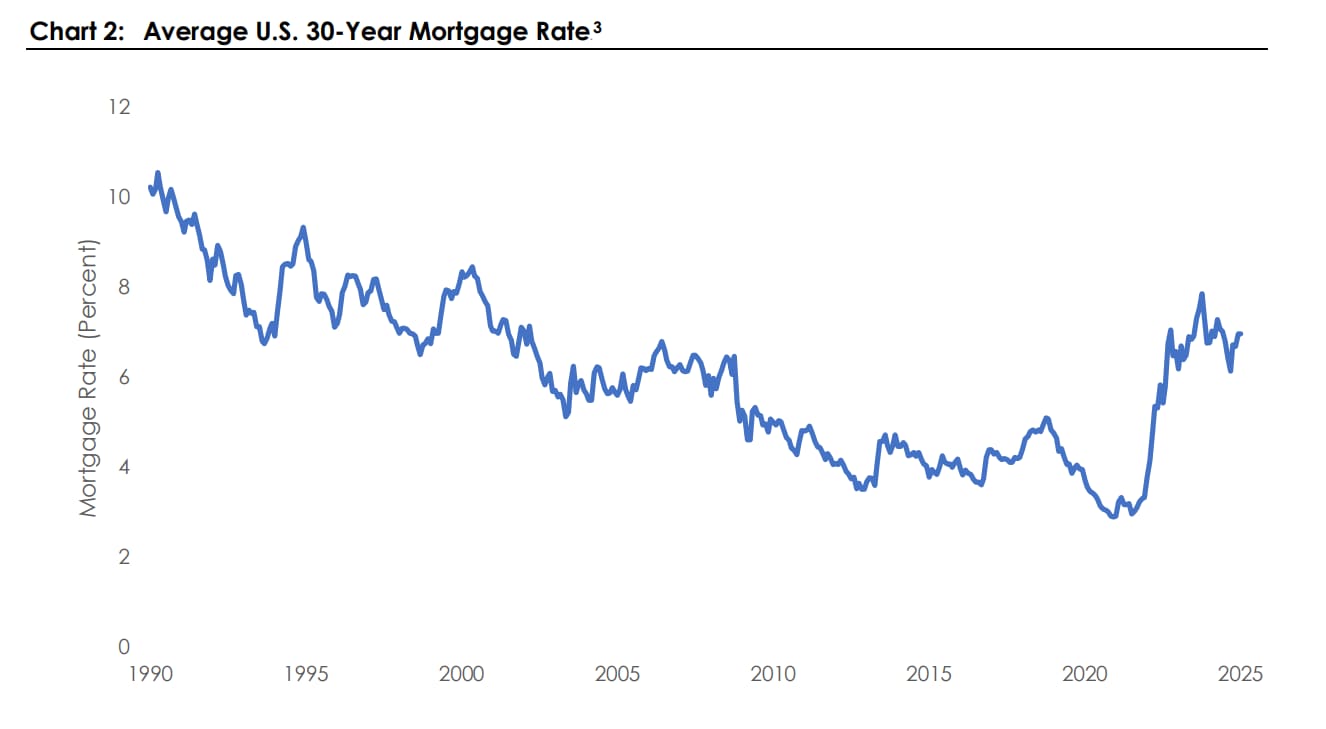
Wait, wait, my dear reader now asks – “you’re saying prices have gone up AND mortgages have gone up…so housing will crash soon, right?!”
Well, not necessarily…but first things first…
To my astute reader’s point, if prices have gone up and mortgages have gone up, then that must mean the cost of home ownership has gone up…a lot. Which brings me to the next chart.
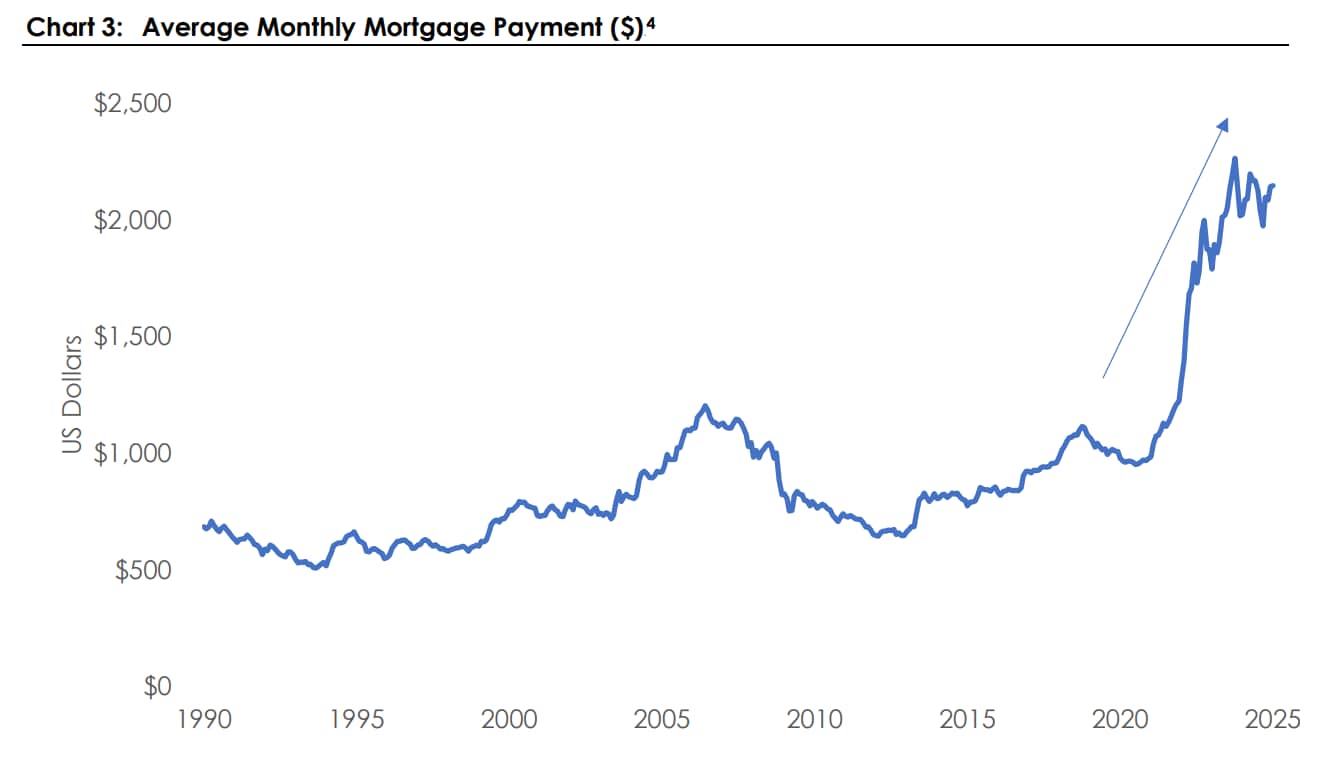
Now we’re getting somewhere … what a chart! Waaaay back in 2020, the average mortgage payment was $975, and that number is now nearly $2,200 just five years later.
In short, ladies and gentlemen, there has not been a more expensive time to buy a home since 1980 (after adjusting for inflation).
So, is a crash imminent? Are prices going higher? Should I buy? Should I sell?
Well, any prediction should always be met with a large dose of skepticism, but there are some key mechanics we can understand.
— First and foremost, principally, when prices (of any asset) are more expensive, that asset becomes less desirable. Logical, right?
— Second, when uncertainty increases, at the margin, humans are less likely to keep pushing prices (of any risk asset) higher.
So those two items would indicate prices should moderate. And moderate they have…which brings us to Chart 4.
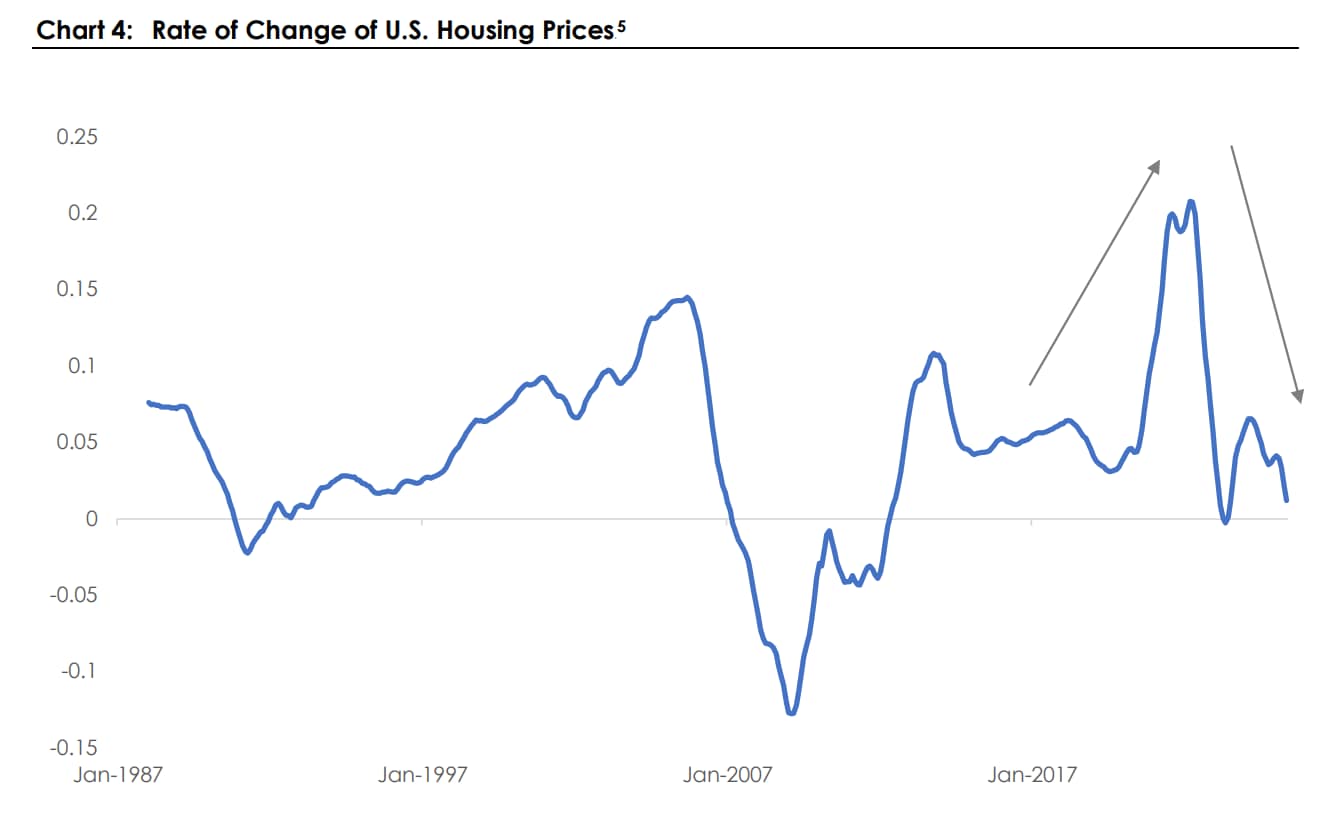
This chart shows the rate of change of housing prices…essentially how fast they are rising (or dropping). And the chart tells us a pretty clear story — the rate of growth has very much slowed, and several data providers (including Zillow and Redfin) are recording decreases in prices across the country. There are now FAR MORE sellers than buyers (1.9 million sellers vs. 1.4 million buyers), and that differential is the highest since the beginning of that index in 2013.
All said, we expect pressure to be on pushing housing prices down, not up and, while we don’t expect anything near the 2007/2008 real estate sell-off, we do expect moderately lower prices. Then again, with deep apologies to Emerson, “the faster he spoke of his prediction, the faster I counted my spoons.”
Discover more from MassMutual …
Market analysis: Tariffs and turbulence
3 tips to avoid locking in losses
Taking cash off the table: Life insurance, annuity alternatives
_____________________________
1 Source: Bureau of Economic Analysis
2 Source: Bloomberg, WMIT, & Case Shiller Index, through June 20, 2025
3 Source: Bloomberg, WMIT, MBA US FRM 30-Year Contract Rate, through June 20, 2025
4 Source: Bloomberg, WMIT, Average Monthly Mortgage based on Current Mortgage Rates, through June 20, 2025
5 Source: Bloomberg, WMIT, Average Monthly Mortgage based on Current Mortgage Rates, through June 20, 2025
6 Source: Redfin