
For financial markets, the first quarter of 2023 was marked by a rollercoaster of volatility, emotions, and sudden shifts in narrative. January saw a strong start to the year with a rally in equity and credit markets as interest rates stabilized and investors took comfort in a big drop-off in the Consumer Price Index. Then, February arrived and with it, data showing a bulletproof labor market and stickier-than-anticipated inflation, leading to a resurgence in Treasury yields and a consolidation in equity markets. Right after short-dated Treasury yields hit their highest levels since before the Great Financial Crisis and strategists began calling for a 6 percent terminal Fed funds rate in early March, the U.S. experienced the second and third-largest bank failures in history behind Washington Mutual in 2008. Fears of a systemic crisis quickly spread as Treasury yields plummeted. The crisis was not contained to the U.S. as Swiss bank Credit Suisse came under enormous pressure and was hastily acquired by UBS.
Markets have been relatively strong despite the Federal Reserve hiking another 25 basis points in March. The NASDAQ, for example, returned 17 percent in the first quarter! However, questions remain on the implications of banking stresses on the overall economy and whether there will be more “accidents” resulting from the Fed’s aggressive interest rate hikes over the last year. The economy appears exceptionally resilient as the labor market remains extremely tight, leaving the Fed in a challenging position as it must now balance fighting stubborn inflation with maintaining financial market stability. A systemic crisis looks to have been avoided for now, but we are prepared for more volatility in 2023 as the economy and markets continue to adjust to higher short term interest rates and a seemingly more fragile backdrop.
 Source: Bloomberg as of March 31, 2023.
Labor market defies calls for recession
Despite consensus assigning a 65 percent probability to the chances of a recession in the next twelve months, labor market data tells a different story. Jobless claims and the unemployment rate remain near historic lows despite a flurry of layoff headlines. “Labor hoarding” has also been blamed for persistent labor market strength amid slowing growth. Because labor is so scarce and many companies laid off workers too aggressively during COVID and were unable to rehire them, companies are more reluctant to lay off workers now for fear they will run into a similar situation. Labor hoarding is putting pressure on margins and forcing companies to look elsewhere to cut costs for the time being.
Estimated 2023 U.S. GDP growth has been revised up from a very weak 0.3 percent at the beginning of the year to approximately 1 percent, compared to growth of 2.1 percent in 2022. The healthy labor market has supported stable consumer spending though inflation pressures continue to weigh most heavily on lower and middle-income households. The housing market and manufacturing sectors continue to cool, and as we have written before, the impacts of monetary policy act with a long and variable lag. Recession remains widely expected but the timing and depth remain a question mark. The “soft landing” versus “hard landing” debate continues with the hard landing getting more attention in light of the banking crisis.
Banking sector breakdown: When the Fed hits the brakes, something breaks
Historically, Fed tightening cycles have led to some type of financial shock whether it was the Savings and Loan crisis in 1990 or the Global Financial Crisis of 2008. This time has been no different with the collapse of three banks (Silvergate, Silicon Valley, and Signature) in a matter of days. Still, this crisis has not been near the same magnitude of failures and financial market stress as 2008. Zooming in on Silicon Valley Bank, both its deposit base (its liabilities) and its investments (its assets) were adversely impacted by the surge in interest rates over the past year. Its deposit base dwindled as higher rates put pressure on its technology and venture-capital centric clients, and its investments in long-dated Treasurys and agencies fell in market value also due to higher interest rates. Throw in social media, mobile banking, and SVB losing 25 percent of its deposits in a single day, and you get the largest bank failure since 2008.
Although the situation appears to have stabilized, these events will likely have long-term implications for small and medium-sized banks, which play an important role in the U.S. economy. According to Goldman Sachs, banks with less than $250 billion in assets account for roughly 50 percent of U.S. commercial and industrial lending, 60 percent of residential real estate lending, 80 percent of commercial real estate lending, and 45 percent of consumer lending. Lending and credit growth leads to economic growth. The risks are that these banks could have a higher cost of capital, less stable deposit base, and be subject to more regulatory pressures, forcing them to tighten their lending and underwriting standards.
 Source: Bloomberg as of March 31, 2023.
Fed continues to hike despite banking system concerns
Last March, the Federal Reserve embarked on its fastest tightening cycle since the early 1980s, aiming to dampen growth while avoiding steering the economy towards a deep recession. Twelve months and 475 basis points of interest rate hikes later, turmoil in the regional banking sector joined still sticky inflation; the Fed’s calibration of policy restraint has only gotten harder. The good news is that headline inflation has fallen for eight consecutive months. The bad news is that February’s headline and core inflation readings of 6.0 percent and 5.5 percent, respectively, are still a long way from the Fed’s 2 percent target, and they are not coming down as fast as most would like. On top of this, the risk of a systemic credit event has replaced stubborn inflation as the key risk to markets for increasingly pessimistic investors, according to Bank of America Corp.’s latest global survey of fund managers.

Source: Bloomberg as of March 31, 2023.
So, what is the Fed to do? At the March FOMC meeting, despite increased uncertainty around the banks potentially having warranted a pause, the Fed raised interest rates by 25 basis points, signaling confidence in its ability to manage financial stability risks. Making clear that elevated inflation is still a top concern, the path ahead is still higher, but the summit is in sight. The median 2023 dot in the Fed "dot plot" lies between 5.00 percent and 5.25 percent, which is only 25 bps higher than the current target range for the federal funds rate. The Fed projects it will hold rates above 5 percent in 2023; however, Treasury markets are pricing in interest rate cuts in the second half of 2023, implying expectations for economic weakness or potential further stress.
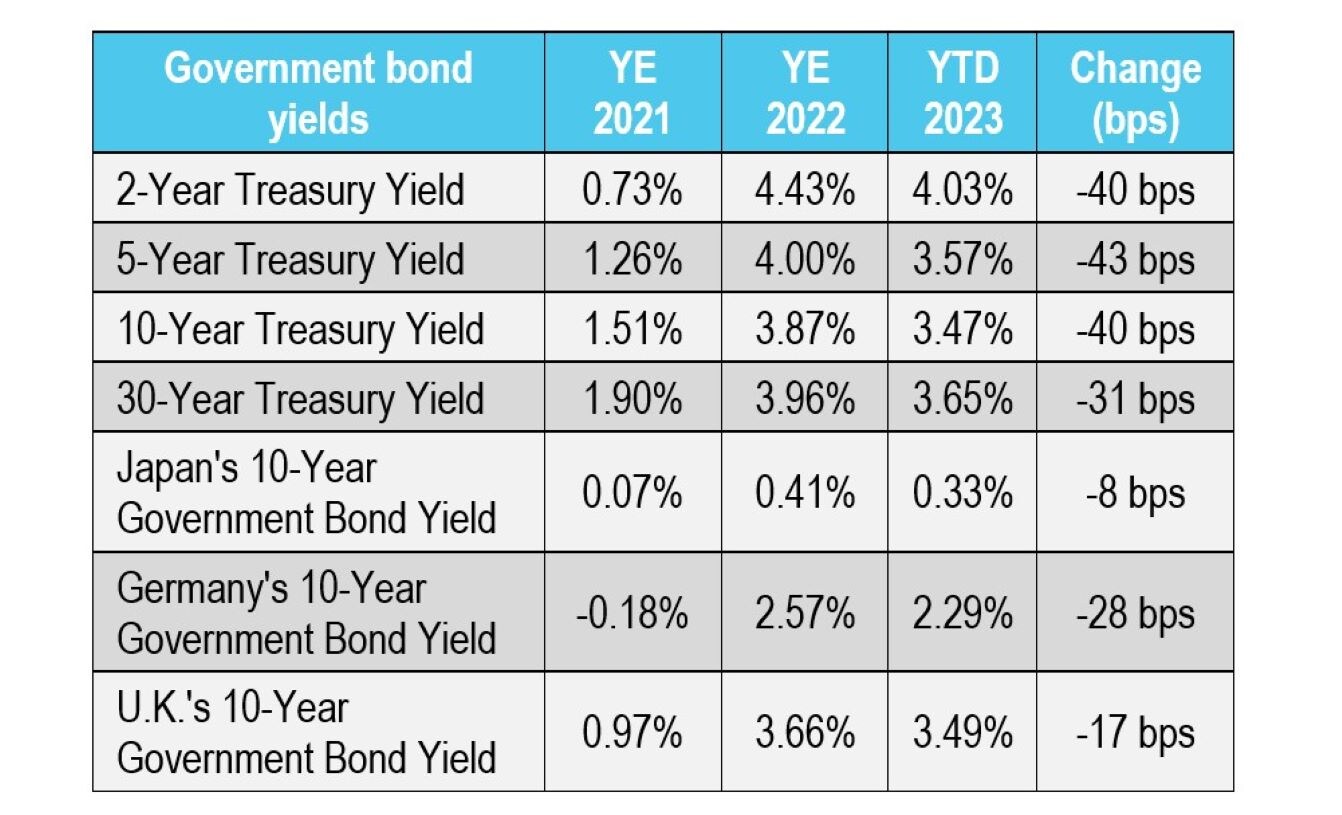 Source: Bloomberg as of March 31, 2023.
Positive start to the year for equity markets despite banking turmoil
Equity markets have remained relatively resilient, ending March and the first quarter on a positive note as the NASDAQ outperformed and entered bull market territory. The retreat in interest rates in the first quarter was a tailwind for equities, especially growth and technology as companies like Facebook/Meta, Apple, Amazon, and Netflix were responsible for most of the gains for the S&P 500. 2023 consensus earnings expectations have been reduced with analysts expecting earnings per share growth of just 1.5 percent for the full year and for earnings growth to contract in the first and second quarters. As we look to first quarter earnings results, attention will surely be on profit margins and managements’ outlooks. Both earnings and profit margins are historically high, which has been supportive of equity markets, but are falling from peak levels. Similar to the rebound in equity markets, corporate credit spreads (a measure of risk or stress) have stabilized and are nowhere near stress or recessionary levels.
Equities continue to face competition from bonds and cash alternatives, which offer much more attractive yields relative to the past several years. A 4.9 percent yield on a 6-month Treasury Bill or 4.4 percent on the aggregate bond index is competitive with the S&P 500 whose earnings yield is around 5.1 percent. Similarly, short-term Treasurys and money market funds offer much higher yields than bank accounts, a dynamic that has been in place for several months but has recently received much more attention due to banks seeing significant deposit outflows. Money market funds assets have soared to more than $5.1 trillion, the highest level on record. Prior surges coincided with large Fed interest rate cuts in 2008 and 2020.
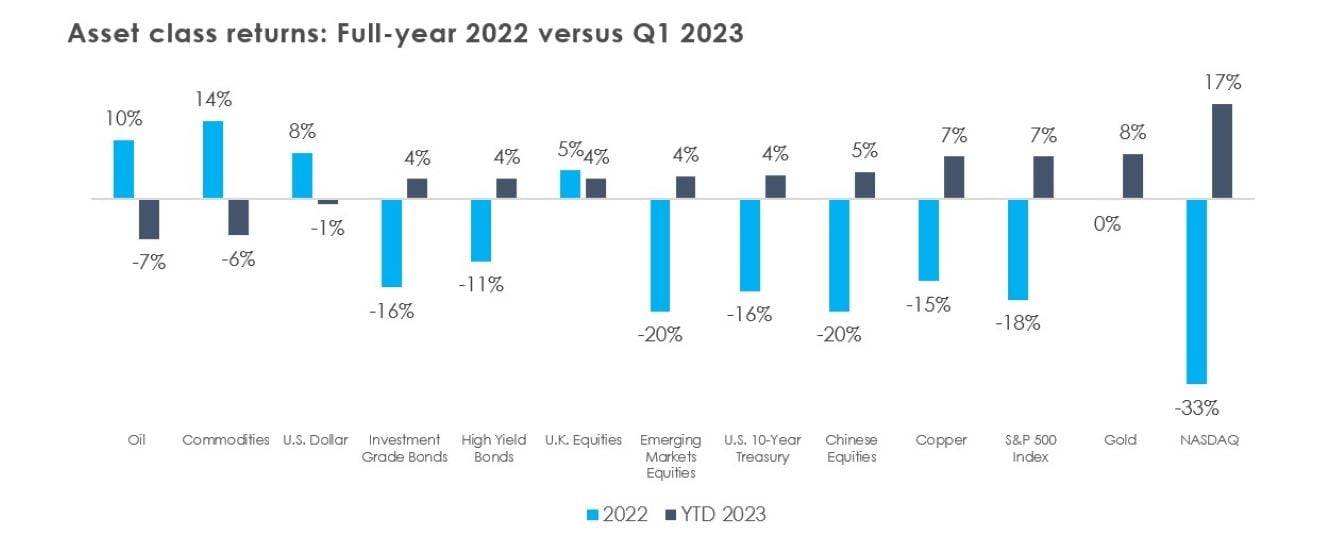
Source: Bloomberg as of March 31, 2023.1
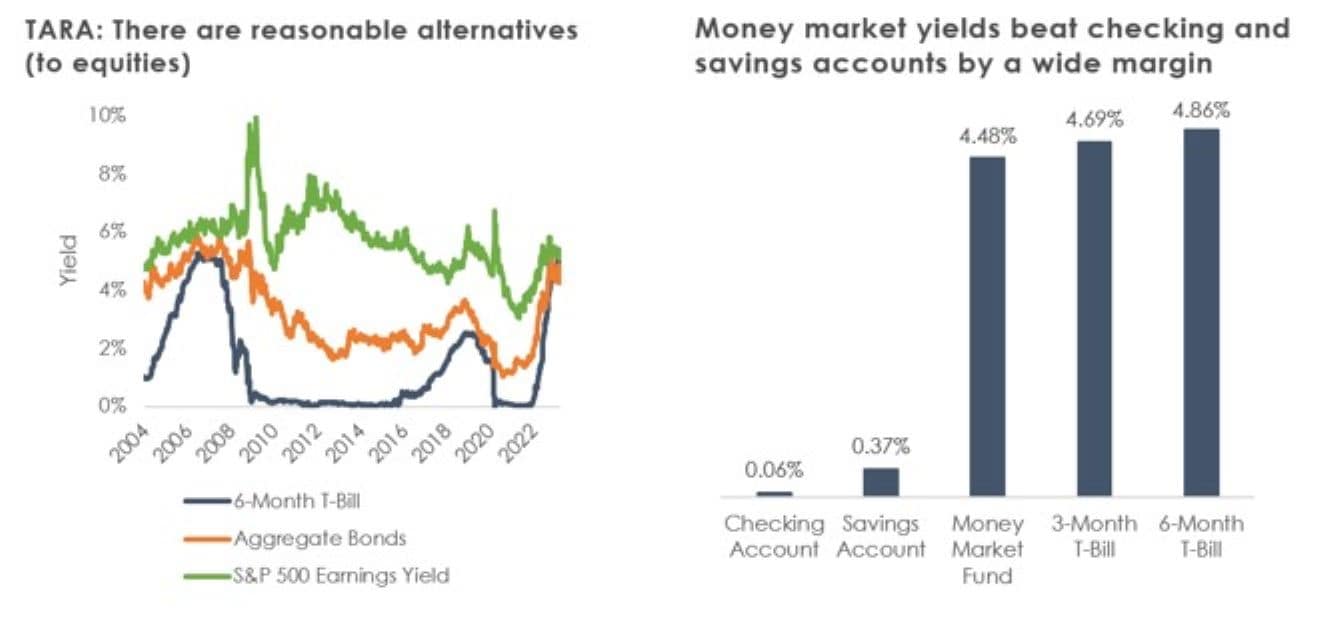
Source: Bloomberg as of March 31, 2023; Aggregate Bonds = Bloomberg U.S. Corporate Investment Grade Bond Index. Checking and Savings Account = FDIC National Average Interest Rates; Money Market Fund = Fidelity Government Money Market Fund (SPAXX).
Looking ahead
As we reflect on the first quarter, investors learned some important lessons. The banking failures showed how markets can react with lightning speed. While 2022 was volatile, the first quarter of 2023 brought the most outsized fixed income volatility swings since the depths of the global financial crisis when Lehman Brothers declared bankruptcy in 2008. If we went back to the beginning of the first quarter and told you that the U.S. would experience two of the largest banking failures in history since 2008, but that equity markets would return 7.5 percent over the quarter, you may not have believed us. This demonstrates the importance of a long-term mindset and that focusing on specific events or short-term outcomes might not be as valuable as one might think to investment performance.
Looking to the remainder of 2023, a more fragile financial backdrop has joined recession and inflation as top concerns. Although the Fed hiked interest rates in March, it has acted swiftly to provide stability to the banking system and has acknowledged the potential impacts of pressures on the banking sector. The Fed’s job has certainly become more difficult as inflation slowly declines, likely leading to continued volatility in interest rate markets, which will likely impact equity markets.
We remain focused on interest rates, valuations, and earnings. Amid all the noise, corporate earnings and interest rates matter most in the long run. Equity valuations remain above historical averages with focus on downside risks to earnings and profit margins. Similarly, credit spreads are near their long-term historical averages and do not reflect recession or systemic risk. Lastly, the Fed’s hiking cycle has upended markets and contributed to the failure of banks, but it has also made fixed income and cash alternatives much more attractive asset classes.
We continue to encourage you to work with a financial professional during these volatile and uncertain times.
Discover more from MassMutual …
Investing basics: What everyone should know
5 ways to prepare for an economic downturn
Income tax diversification defined
___________________