.jpg?h=920&iar=0&w=2280)
| ||||||||||||

There’s a wonderful story about a British naval vessel in the 1850s.1
As the story goes, its well-regarded captain stood on the bridge of the battleship just before he was set to retire to dinner for the evening when a lookout suddenly announced, “Light, sir, dead ahead two miles.”
The captain turned back toward the helm.
“Is it steady or moving,” he asked (this was in the time before radar).
“Steady, Captain.”
“Then signal that ship,” the captain ordered gruffly. “Tell them, ‘You are on a collision course. Alter course 20 degrees.’”
The answer, from the source of the light, came back moments later: “Advisable you change your course 20 degrees.”
The captain was insulted! Not only was his authority being challenged, but also it was being done in front of a junior seaman!
“Send another message,” he snarled. “We are the HMS Defiant, a 35 thousand ton battleship on the dreadnaught class. Change course 20 degrees.”
“Brilliant, sir,” came the reply. “I’m Seaman O’Reilly of the second class. Change your course immediately.”
Incensed and red in the face, the captain shouted, “We are the flagship of the Admiral Sir William Atkinson-Willes! CHANGE YOUR COURSE 20 DEGREES!”
There was a moment of silence before Seaman O’Reilly replied, “We are a lighthouse, sir.”
State of the State…
And so, with the grand ambition to occasionally act as a lighthouse for our beloved clients and colleagues, today we set out to offer a similar perspective. You see, in a world filled with partisan news, skewed stories, half-truths, and more hyperbole than we think reasonable, we try to simply rely on a mosaic of data and charts to offer perspective on the state of the economy. And with that, let us begin…
First, let us zoom out and focus on perhaps the most misunderstood form of data: U.S. Economic Growth.
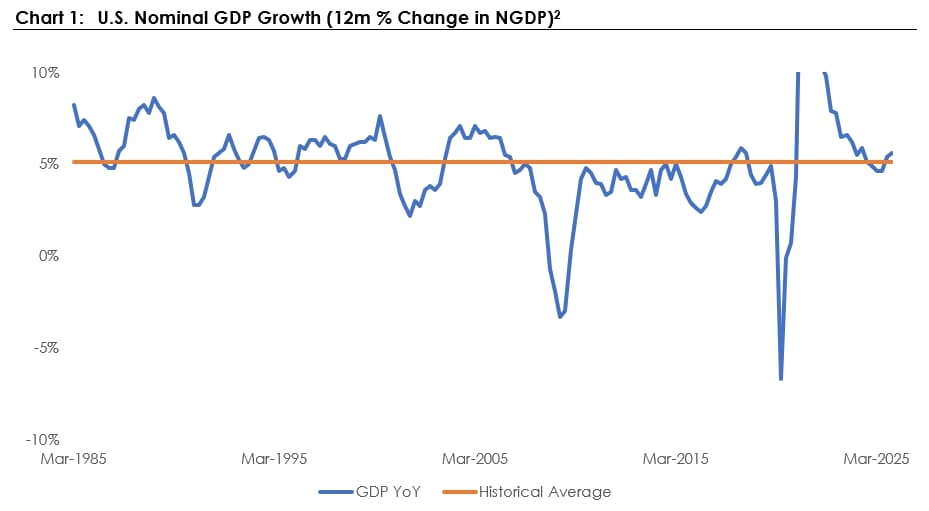
Chart 1 shows the year-over-year percentage change in how the U.S. economy is growing. This includes all goods and services. Zoom out, blur your eyes, and what do you notice? Meh—from this perspective at least, things are fine. The U.S. economy is growing at a rate that is pretty similar to what it has been for the past 40 years. Not exceptional and not terrible.
Wait, wait, you say! You’re hiding what’s really going on more recently. Well, let’s not take an average then, and instead just look at each quarter (unfortunately good monthly data doesn’t really exist). Which brings us to Chart 2.
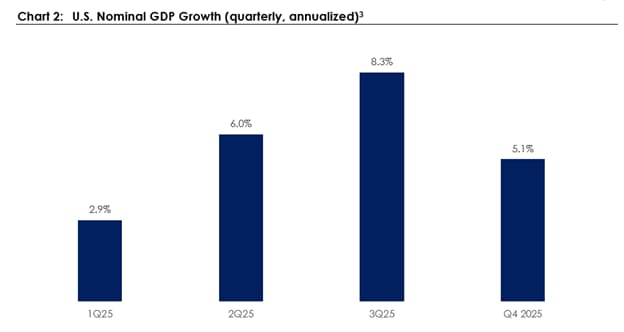
Yes, each quarter tells a slightly different story (and yes, I’m looking at you, government shutdown for Q4), but in aggregate, again, things are okay. Growth is reasonable, and each quarter continues to be strong.
“Okay, okay,” you say. “I’ve seen this story before! Inflation will get us all!”
Well, yes, maybe, and I don’t like it either…but let’s just look at the data itself. Which brings us to Chart 3.
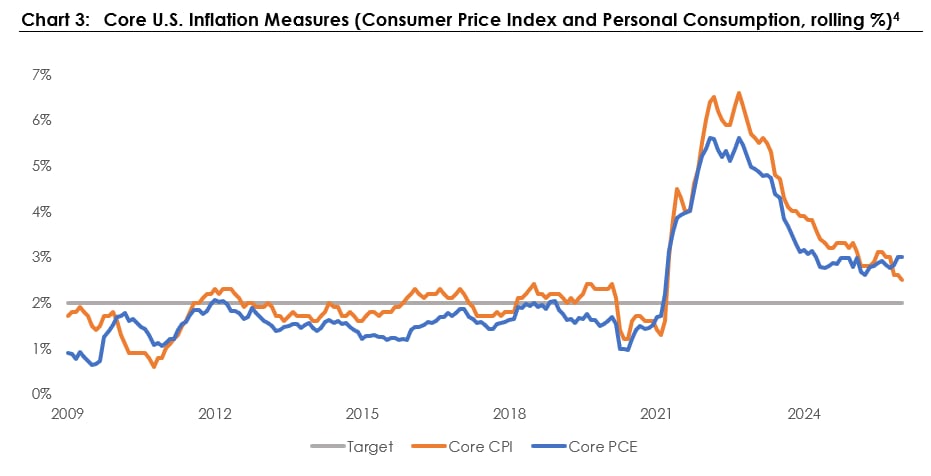
Well, what do we notice?
- First and foremost, inflation went up a lot in 2022, then fell nearly as much, and has gone flat-ish for a bit.
- Second, by and large, the Federal Reserve targets an average of 2 percent for inflation, and inflation is a bit higher than that.
- Third, inflation has a long and annoying history of rearing its ugly head longer than most would have wanted, and often when it is least expected. We aren’t seeing many signs of that yet, but we’re watching closely.
The AI factor
“Fine!” you say. “Be that way! You’ve got me on two items, but I’ll get you on the third! AI is destroying the world, and the job market is falling apart, and THAT will be the downfall.”
Well, now, that is a solid point and despite my many, many hours of studying the space, I still have very little clarity on how this will play out. With that said, we can rely on data, and data we have plenty of.
Which brings us to Chart 4.
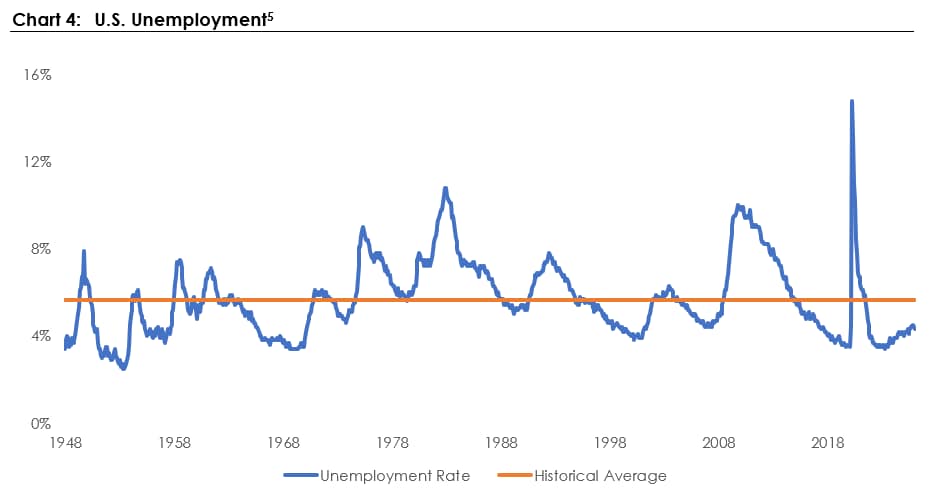
Chart 4 shows us the number of people in the United States that are not working (and who want to be) divided by the total number of people available to work … in short, the unemployment rate.
And this time, let’s go back all the way to just after the end of World War II.
I have several observations.
- First, unemployment is VERY low. In fact, at 4.2 percent, it is one of the lowest readings in the past 80 years.
- Second, current unemployment is FAR below average unemployment over the past 80 years.
- Third, yes, there has been a slight increase in unemployment since the middle of 2023. Is it significant? No, not really, but this is what is being referenced when doomsayers speak about the ”weakening labor market.”
Okay, so where does that leave us? All in, a reasonably good place by historical standards.
In the United States:
- Growth is reasonably strong. Not amazing, but good.
- Inflation is much lower than previously. Not as low as we want (which is why the Fed won’t cut rates significantly), but certainly much lower than it was, and fairly steady at the moment.
- And, despite the hyperbole, unemployment is low, which means people are employed. When people are working, they are receiving paychecks. They are then using those paychecks for more spending or more borrowing (often a combination of both).
Does that mean everything is perfect? No, absolutely not. Between geopolitical risks, tariffs, the impact of AI (and AI investment), the consumer, etc., etc., there are risks aplenty. Yet, big picture, over the long run, markets have historically been influenced by the underlying economic conditions, and, right now, the economy is in a relatively stable state (despite many challenges).
We remain at your service and watching closely, and please try to avoid those lighthouses.
Discover more from MassMutual …
Stupidity, achievement, and appreciating our progress
Understanding the basics of investing
How to increase your net worth
_______________________________
1 From the brilliant and remarkably insightful book “Emotional Agility,” by Susan David, PhD; Steven Covey also famously used a reference to it in his book.
2 Source: WMIT; Bloomberg; as of Feb. 25, 2026.
3 Source: WMIT; Bloomberg; as of Feb. 25, 2026.
4 Source: WMIT; Bloomberg; as of Feb. 25, 2026.
5 Source: WMIT, Bloomberg, St. Louis Federal Reserve through February 25, 2026