
2025 defied traditional playbooks. Job growth stalled and even contracted in June, August, and October, yet the economy grew at a 4 percent pace during the second and third quarters. Consumer sentiment plunged to multi-decade lows, tariffs reached levels reminiscent of another era, and the U.S. experienced its longest government shutdown on record. Gold soared past $4,300/oz and silver more than doubled in value. By any traditional measure, many of these signals should have spelled trouble: recession fears, stressed credit markets, and risk assets on the ropes. Instead, the market’s response was anything but predictable. U.S. equities posted double-digit gains, earnings growth remained consistently robust, investment grade credit spreads hovered near historic lows, and annual GDP is tracking close to its 2 percent long‑run potential. The only outlier? The U.S. dollar, which lost ground in 2025.
This paradoxical landscape, where conventional wisdom failed and surprises ruled, sets the tone for investors as we head into 2026. The key questions now revolve around the durability of risk asset returns given elevated valuations and the path for interest rates as a new Fed chair takes the helm amid a divided committee weighing labor market risks versus lingering inflation.
Despite the ongoing trade overhang, fiscal challenges, and labor market weakness, three forces continue to drive the economy and markets: the uneven consumer landscape of the K-shaped economy, substantial investment and spending related to Artificial Intelligence (AI), and a policy mix defined by simultaneous fiscal stimulus and monetary easing. Although each of these forces support growth and asset prices, they also raise some uncertainties, prompting investors to constantly reassess and adjust their outlook for what comes next.
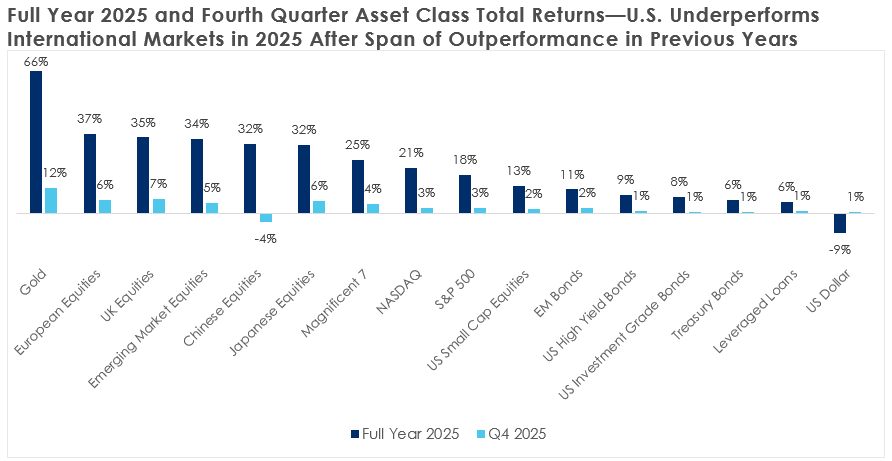
Source: Bloomberg as of December 31, 2025. All indices are measured in USD. Magnificent 7 = Bloomberg Magnificent 7 Total Return Index; NASDAQ = NASDAQ Index; S&P 500 = S&P 500 Index; Japanese Equities = Nikkei 225 Index; European Equities = Stoxx 600 Index; US Small Cap Equities = Russell 2000 Index; US High Yield Bonds = Bloomberg US Corporate High Yield Total Return Index; Leveraged Loans = Bloomberg US Leveraged Loan Index; Gold = Gold Spot Price; Oil = Oil Spot Price; US Dollar = U.S. Dollar Index; Emerging Market Equities = MSCI Emerging Markets Index; Emerging Market Bonds = Bloomberg Emerging Markets Aggregate Bond Index; US Investment Grade Bonds = Bloomberg U.S. Corporate Investment Grade Index; Treasury Bonds = Bloomberg US Treasury Total Return Index; Chinese Equities = Hang Seng Index; UK Equities = FTSE 100 Index.
The K-shaped economy: How divergence defines today’s world
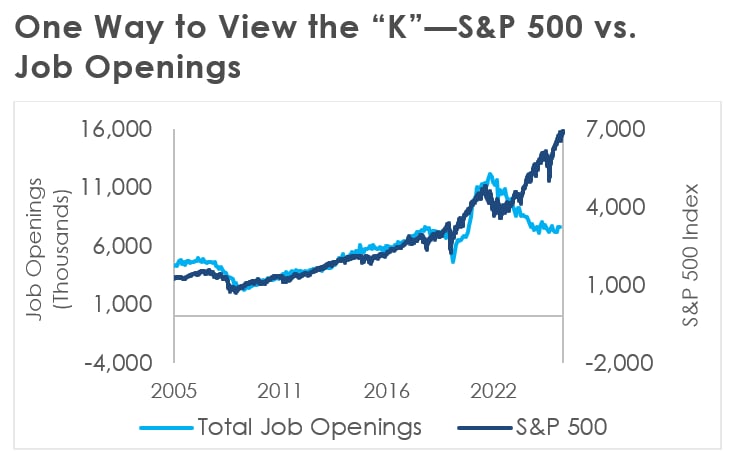
The “K‑shaped economy” describes a regime where economic benefits accrue differently across households and firms. One segment benefits from rising wealth, strong corporate earnings, and healthy balance sheets, while the other faces persistent affordability challenges, weaker income growth, and limited access to asset-driven gains. The divergence resembles the two arms of the letter K. Although inequality has been a slow‑moving structural trend for decades, 2025 brought the concept sharply into focus.
Source: Bloomberg as of December 31, 2025.
In 2025, wealth concentration and asset ownership remained as core drivers of consumer trends. Consumption patterns in the U.S. are heavily influenced by net worth, and, according to the Board of Governors of the Federal Reserve System, as of Q2 2025, the top 10 percent of households by income hold almost two-thirds of the nation’s wealth. In parallel, according to the U.S. Bureau of Labor Statistics, the top income decile also accounts for nearly half of all consumer spending. AI investment created a narrow but powerful source of profitability, productivity, and asset appreciation, with these gains benefiting AI-focused companies and the households holding their equities. As a result, spending among affluent households remained resilient even as broad consumer sentiment appeared gloomy.
Why did consumer sentiment plummet? Because the lower arm of the K faced persistent inflation, tariff‑driven goods price increases, softer job opportunities, and restrictive credit financing and mortgage rates. As these pressures mounted and purchasing power eroded, financial stress became more visible. Delinquencies across credit cards, autos, and student loans all moved higher. At the same time, median nominal wage growth for lower earners continued to lag the pace of higher earners. In other words, this segment of the population not only failed to benefit from asset appreciation but also confronted a softer labor market, higher prices, and weaker wage growth.
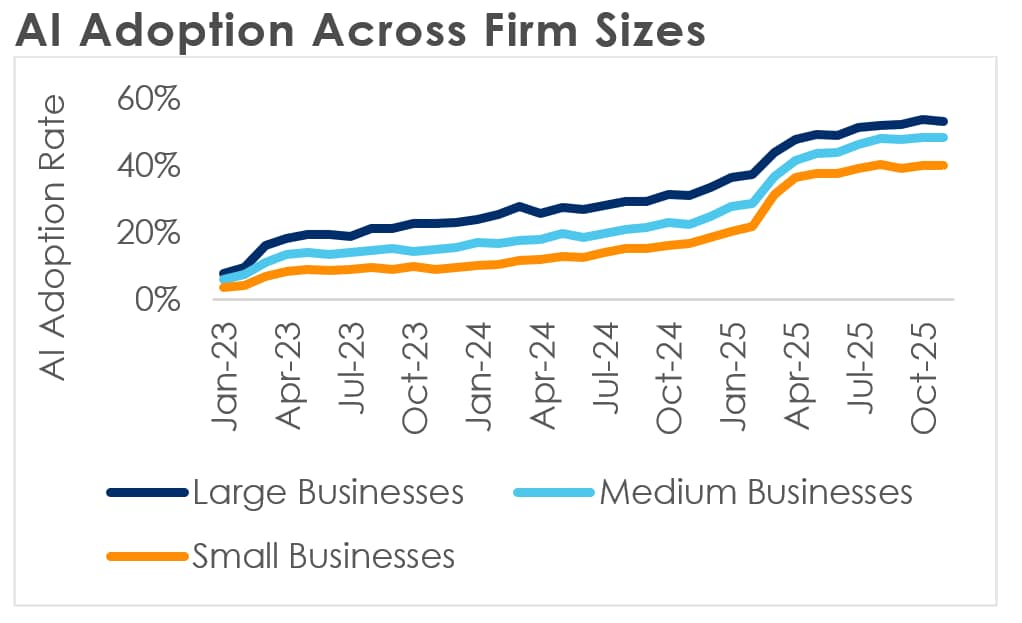
Looking at 2026, the K-shape is likely to persist and could potentially widen. Labor supply is likely to be constrained by limited immigration, while labor demand softens as job openings remain weak and AI adoption grows. These forces move in opposite directions, so the net effect on the K‑shape is somewhat offsetting. However, according to the Ramp AI adoption rate, usage across firm sizes has risen from below 10 percent in 2023 to about 30 percent to 50 percent today. Even with signs that adoption is flattening, the trajectory points toward ongoing integration of AI tools, which naturally reduces the need for incremental hiring and tilts risks toward a wider K‑shape.
Source: Bloomberg, Ramp AI, Apollo, and JPMorgan as of December 31, 2025.
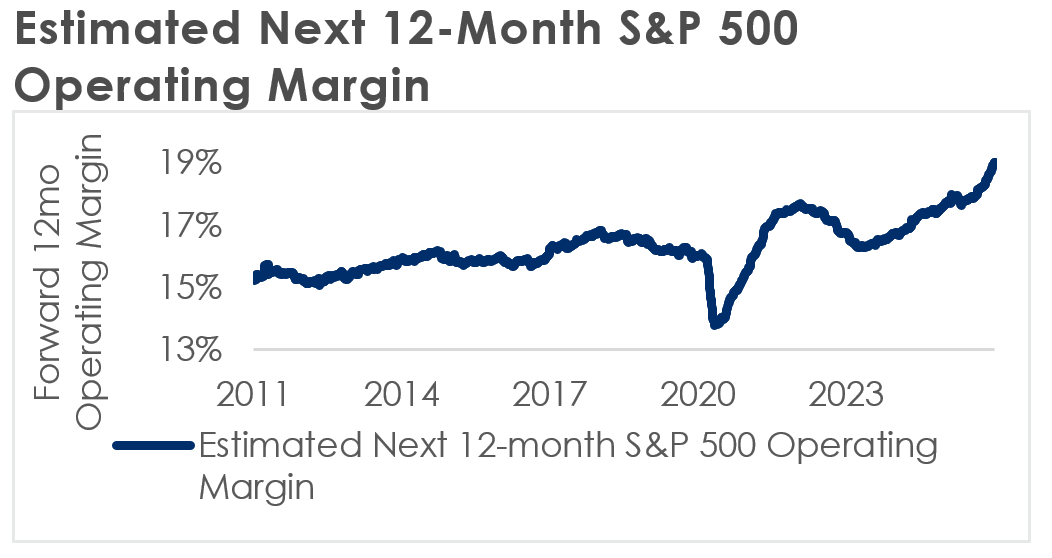
Firm-level concentration within the S&P 500 is expected to remain elevated, with the top 10 companies already accounting for over 40 percent of market capitalization entering 2026. However, aided by AI-driven efficiency gains and potential rate cuts, expected 2026 earnings growth of 19 percent for the Magnificent 7 figures to be complemented by broadening out, as the rest of the index is projected to grow a solid 12 percent, providing meaningful support for the wider market and those who own financial assets.
Source: Bloomberg and Strategas as of December 31, 2025.
Finally, on inflation, several forces could point toward persistence or re-acceleration. According to the Tax Foundation, the One Big Beautiful Bill is set to generate one of the largest tax refund seasons on record, with households receiving roughly $144 billion in tax relief. In addition, the bill includes business tax cuts estimated at $200–$300 billion. Tariffs and the fading impact of the initial trade war shock may continue to exert upward pressure on prices. Lastly, the new Federal Reserve Chairman is expected to lean dovish, creating the possibility of easier policy even as inflation remains above target. Bloomberg economist consensus reflects these forces in 2026 CPI expectations, which have risen from 2.5 percent at the beginning of the year to 2.8 percent today. This backdrop reinforces the likelihood of a more pronounced K‑shape.
The Federal Reserve: Economics & politics
Entering 2025, the Federal Reserve confronted a resilient economy and stubborn inflation. Activity was steady, labor markets looked healthy, and the Committee emphasized patience until it gained more confidence that inflation was moving durably toward target.
As the year progressed, however, the macro balance shifted meaningfully. Labor indicators softened across job openings, quits, and hiring momentum; wage growth moderated; and core inflation continued its gradual decline. Policymakers responded by resuming rate cuts in September, framed as “risk management” rather than outright stimulus, with additional cuts in October and December.
The 2026 policy path of least resistance remains unclear. The most recent CPI reading, although still affected by data disruptions earlier in the year, showed more progress than expected, driven by continued disinflation in goods and shelter, easing in services inflation, and limited energy‑driven pressure. Still, upside risks persist, including the consumption boost from tax refunds and lingering tariff effects. On the labor side, job cut announcements have reached their highest level since 2020 at approximately 1.2 million, nonfarm payroll gains since May total less than 100,000, and unemployment has risen to 4.4 percent after holding near 4.0–4.2 percent for most of 2024 and 2025. Still, unemployment is broadly consistent with full employment, and net immigration remains low or negative, complicating readings of labor supply. Meanwhile, GDP growth has held close to its long‑run potential and is expected to receive a further fiscal boost of roughly 0.9 percent from the One Big Beautiful Bill. Additionally, the real federal funds rate (i.e., fed funds rate less inflation) is at its least restrictive level since mid‑2023.
Regardless, will the Federal Reserve continue to cut the federal funds target rate? The answer to that seems to be, yes. Futures pricing implies two to three cuts in 2026, which is modestly more aggressive than the FOMC’s Dot Plot, which shows a median expectation of one 25 basis point cut. But market expectations have been volatile as the implied policy rate for the December 2026 FOMC meeting has swung from nearly 4 percent in late 2024 to roughly 2.8 percent in mid‑2025, highlighting how quickly rate expectations can shift in response to changing sentiment or information.
Source: Bloomberg as of December 31, 2025.
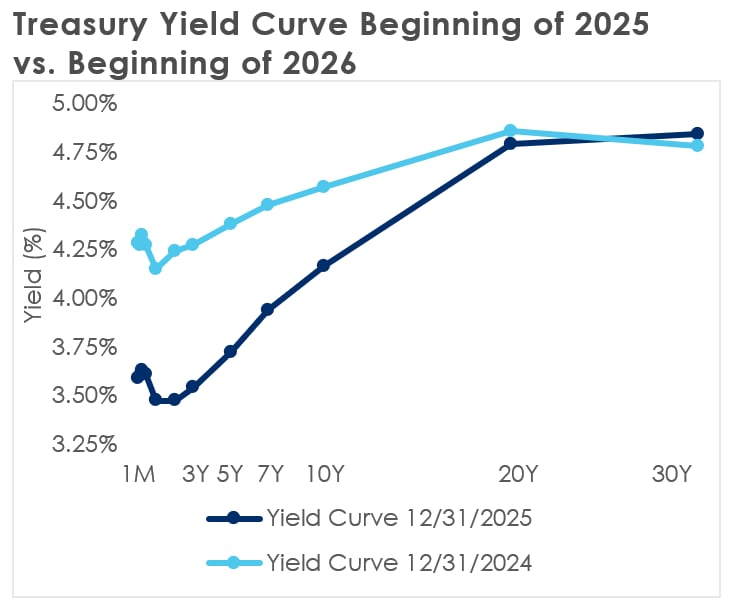
Whether the market believes the Federal Reserve should cut is a separate question. The market’s perception of short-term rates likely reflects not only the mixed signals in the data but also the belief that the next Fed Chairman will push for lower interest rates. This makes short‑term rate expectations more a reflection of expected outcomes than a clear judgment of what is prudent. Long‑term rates, by contrast, may offer a more meaningful signal. Atypical relative to previous interest rate cutting cycles, long‑term yields have remained stubbornly high even with a cumulative 175 basis points of rate reduction since September 2024. As estimated by the New York Fed, the term premium, or additional compensation for holding longer-term bonds, has expanded by about 100 basis points, reflecting concern about the risk of cutting into persistent inflation, the likelihood of budget deficits remaining in the 6 percent to 7 percent of GDP range, national debt above $38.5 trillion with the One Big Beautiful Bill alone adding more than $3.4 trillion in additional debt over the next decade, and uncertainty around Fed independence.
The combination of rate cuts and fiscal stimulus is a tailwind heading into 2026 but could introduce overheating risks as growth improves. The combination could also sustain inflation and keep long‑term yields elevated in spite of front‑end cuts, preventing financial conditions from easing as policymakers expect. As a result, the coming year may be defined less by the number of rate cuts delivered and more by the interaction between monetary easing, fiscal expansion, and the behavior of long‑duration yields.
Equity markets: A constructive setup
Equity market volatility in 2025 emerged with the “Liberation Day” tariffs, which pulled the S&P 500 into a nearly 20 percent peak-to-trough drawdown. Markets rebounded after U.S. trade concessions and then accelerated as the AI investment boom strengthened, producing a narrow but powerful rally that pushed the index to a roughly 37 percent gain from the trough and roughly a 16 percent increase on the year.
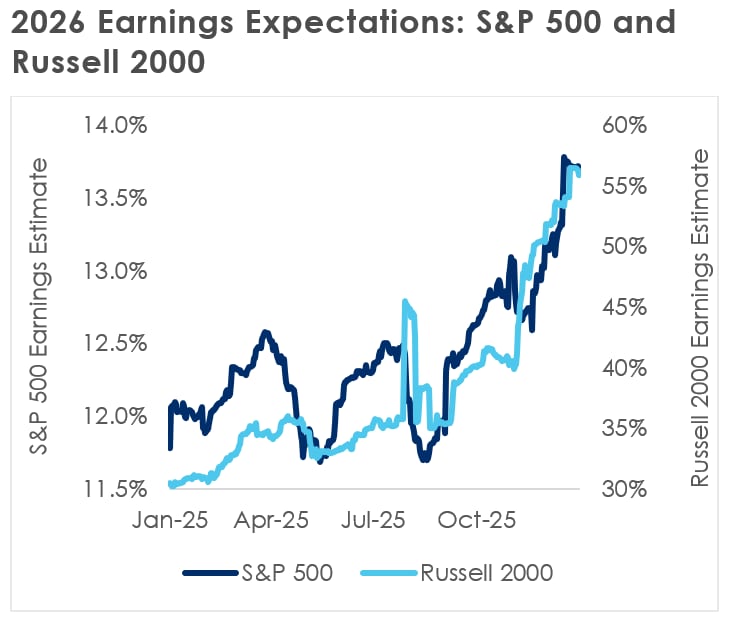
The outlook for 2026 reflects an unusual policy mix. Fiscal stimulus, monetary easing, and deregulation are all operating pro-cyclically at a time when the economy is neither in recession nor emerging from one. Although tariff risks and trade tensions persist, the harshest outcomes feared after “Liberation Day” have not materialized. This backdrop is supportive for U.S. equities, and forward earnings corroborate this. Consensus expects S&P 500 earnings to rise nearly 14 percent in 2026 and Russell 2000 earnings to increase more than 56 percent.
Source: Bloomberg as of December 31, 2025.
A major driver of both 2025 performance and 2026 expectations is the AI investment boom. However, the same boom driving near‑term earnings strength is also generating significant risks in the form of elevated valuations, extreme concentration, and potential bubbles.
The S&P 500’s cyclically adjusted price‑to‑earnings ratio, near 38x, is approaching its 2022 peak, with only the dot‑com era exhibiting richer valuations. Historically, such elevated multiples have been associated with weaker subsequent returns. Concentration has followed a similar trajectory as the top 10 companies now comprise roughly 41.5 percent of the S&P 500 market capitalization, up from about 25 percent five years ago, and the top 5 concentration is above 30 percent, the highest end of year figure through multiple decades. Elevated concentration increases fragility as firm‑specific news can create broader volatility that can spill over into the real economy. Risks are compounded by the scale of AI‑related spending itself, with capital expenditures estimated to exceed $400 billion in 2025 and some analyst projections placing 2026 spending between $525 billion and $575 billion.
At the same time, several forces temper concerns. Earnings and earnings growth remain robust, corporate balance sheets are broadly healthy, and AI‑driven efficiency gains are likely to become more visible as adoption expands and innovation persists. Computational demand still exceeds available supply by a wide margin and is expected to remain constrained for years, reinforcing the durability of AI‑related spending. Much of this investment also appears structural and relatively resilient to cyclical slowdowns. That said, volatility is expected as markets continually reassess whether rising AI expenditures are producing the productivity and earnings growth implied by current prices.
Credit: Supply, supply, supply
In 2025, regardless of a few high-profile bankruptcies, credit markets experienced a confluence of strong technical factors, including persistent demand for elevated yields, and solid fundamental factors, such as robust full‑year earnings, which together kept overall credit spreads tight. As of the end of 2025, investment grade credit spreads sat just below 80 basis points, well below the historical average of 145 basis points, and high yield spreads have compressed to around 265 basis points, compared to a long‑term average of 510 basis points.
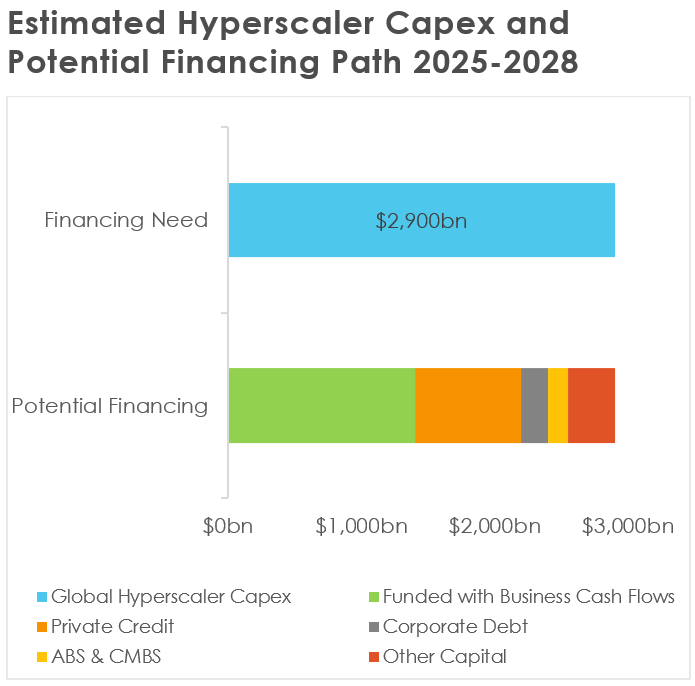
As we noted last quarter, a key force behind tight credit spreads has been net supply, defined as gross issuance minus maturities and called bonds. In 2026, JPMorgan estimates that net supply, after coupon reinvestment, will triple due to both AI‑related hyperscaler capital expenditures financing and increased M&A related issuance, turning a previous credit spread tailwind into a headwind.
This surge represents a technical challenge rather than weakening credit quality, especially since many technology issuers maintain strong balance sheets and substantial debt capacity. However, these issuers have also shown themselves to be less price sensitive, given the strategic importance of their AI investments.
This trend is reshaping credit markets, with its impact most evident in market composition. Historically, large-cap tech firms have issued relatively few bonds despite their size. As their financing needs expand, they are poised to represent a growing share of bond issuance, increasing concentration in credit markets, similar to the dynamic already seen in equities.
Source: Morgan Stanley as of November 16, 2025.
This shared AI exposure introduces growing concentration and correlation risk. As a result, diversification becomes even more critical in 2026 and beyond. Not just across industries, obligors, or asset class, but across secular themes, recognizing that a single technological trend is shaping credit exposure across multiple market segments simultaneously.
Looking ahead
The landscape entering 2026 is defined by powerful, overlapping forces that both support growth and point to ongoing questions. AI‑driven investment continues to lift earnings and augment future productivity, fiscal and monetary policy remain supportive, and consumer spending is holding up, especially at the top end of the distribution. At the same time, labor markets are softening, inflation risks remain, and long‑term rates have stayed elevated despite front‑end easing. Equity valuations and market concentration are historically high, and credit markets are preparing for a surge in AI‑related issuance that will reshape benchmarks and increase correlation across everything from asset classes to issuers.
While several supportive factors are in place as we enter 2026, the path ahead is unlikely to be smooth. Growth is expected to hold up especially as productivity gains materialize and financial conditions ease, but risks remain: inflation may re-accelerate, long-term yields could stay elevated, and volatility may rise as investors reassess the returns on significant AI spending and the sustainability of fiscal policy. Additionally, domestic policy and geopolitics remain a source of potential exogenous shocks, as demonstrated by tariff policy in 2025 and Venezuela events in 2026. In an environment where traditional signals provide less clarity, diversification across and within secular themes becomes essential for managing risk. Positioning for 2026 is less about predicting a single outcome and more about preparing for a wide range of potential scenarios.
We wish you a great 2026 and strongly encourage you to consult with a financial advisor in navigating this complex financial and economic landscape.
_______________________________
Disclosures
Market Indices have been provided for informational purposes only; they are unmanaged and reflect no fees or expenses. Individuals cannot invest directly in an index.
|
Description |
|
Bloomberg Magnificent 7 Total Return Index is an equal-dollar weighted equity benchmark consisting of a fixed basket of 7 widely-traded companies classified in the United States and representing the Communications, Consumer Discretionary and Technology sectors as defined by Bloomberg Industry Classification System (BICS). |
|
The NASDAQ Composite Index is a broad-based capitalization-weighted index of stocks in all three NASDAQ tiers: Global Select, Global Market and Capital Market. |
|
The S&P 500 Index is widely regarded as the best single gauge of large-cap U.S. equities and serves as the foundation for a wide range of investment products. The index includes 500 leading companies and captures approximately 80% coverage of available market capitalization. |
|
The Nikkei-225 Stock Average is a price-weighted average of 225 top-rated Japanese companies listed in the First Section of the Tokyo Stock Exchange. The Nikkei Stock Average was first published on May 16, 1949, where the average price was ¥176.21 with a divisor of 225. |
|
The STOXX Europe 600 Index is derived from the STOXX Europe Total Market Index (TMI) and is a subset of the STOXX Global 1800 Index. With a fixed number of 600 components, the STOXX Europe 600 Index represents large, mid and small capitalization companies across 17 countries of the European region. |
|
The Russell 2000 Index is comprised of the smallest 2000 companies in the Russell 3000 Index, representing approximately 8% of the Russell 3000 total market capitalization. The real-time value is calculated with a base value of 135.00 as of December 31, 1986. The end-of-day value is calculated with a base value of 100.00 as of December 29, 1978. |
|
The Bloomberg US Corporate High Yield Bond Index measures the USD-denominated, high yield, fixed-rate corporate bond market. Securities are classified as high yield if the middle rating of Moody's, Fitch and S&P is Ba1/BB+/BB+ or below. Bonds from issuers with an emerging markets country of risk, based on Bloomberg EM country definition, are excluded |
|
The Bloomberg US Leveraged Loan Index measures the performance of USD denominated, high-yield, floating-rate, institutional leveraged loan market. The US Loan Index was created in 2024, with history backfilled to January 1, 2019. |
|
Oil Spot Price is quoted as dollars per barrel for export quality Brent crude oil. |
|
Gold Spot Price is quoted as dollars per Troy Ounce. |
|
The U.S. Dollar Index (USDX) indicates the general international value of the USD. The USDX does this by averaging the exchange rates between the USD and major world currencies. The ICE US computes this by using the rates supplied by some 500 banks. |
|
The MSCI EM (Emerging Markets) Index is a free-float weighted equity index that captures large and mid-cap representation across Emerging Markets (EM) countries. The index covers approximately 85% of the free float-adjusted market capitalization in each country. |
|
The Bloomberg Emerging Markets Hard Currency Aggregate Index is a flagship hard currency Emerging Markets debt benchmark that includes USD-denominated debt from sovereign, quasi-sovereign, and corporate EM issuers. |
|
The Bloomberg US Corporate Investment Grade Index measures the investment grade, fixed-rate, taxable corporate bond market. It includes USD denominated securities publicly issued by US and non-US industrial, utility and financial issuers. |
|
The Bloomberg US Treasury Index measures US dollar-denominated, fixed-rate, nominal debt issued by the US Treasury. Treasury bills are excluded by the maturity constraint but are part of a separate Short Treasury Index. STRIPS are excluded from the index because their inclusion would result in double-counting. |
|
The Hang Seng Index is a free-float capitalization-weighted index of a selection of companies from the Stock Exchange of Hong Kong. The components of the index are divided into four subindices: Commerce and Industry, Finance, Utilities, and Properties. The index was developed with a base level of 100 as of July 31, 1964. |
|
The FTSE 100 Index is a capitalization-weighted index of the 100 most highly capitalized companies traded on the London Stock Exchange. The equities use an investibility weighting in the index calculation. The index was developed with a base level of 1000 as of December 30, 1983. |
Past performance is no guarantee of future performance or market conditions. Investing involves risk including the possible loss of principal. Investment return and principal value will fluctuate so that when sold may be worth more or less than the original cost.
Use of political figures or statements is solely for reference and relevance to financial markets and is not meant to be an endorsement or a reflection of the company’s opinion or position.
This material is intended for informational purposes only and does not constitute a recommendation to engage in or refrain from a particular course of action. The information within has not been tailored for any individual and is not intended as tax, legal or investment advice.
The views and opinions expressed are those of the author as of the date of the writing and are subject to change without notice. Although the information has been gathered from sources believed to be reliable, it is not guaranteed. Please note that individual situations can vary, therefore, the information should be relied upon when coordinated with individual professional advice. Clients must rely upon his or her own financial professional before making decisions with respect to these matters.
This communication may include forward-looking statements or projections that are subject to certain risks and uncertainties. Actual results, performance, or achievements may differ materially from those expressed or implied.
Investments discussed may have been held in client accounts as of September 30, 2025. These investments may or may not be currently held in client accounts.