
When the war unfolded and the Strait of Hormuz was shut, few envisioned that crude prices, having climbed more than 70 percent to over $110 per barrel as the conflict intensified, would finish the quarter slightly below $70 per barrel, just 6.5 percent above pre-conflict levels, or that U.S. equity markets would post their best quarterly total returns since 2020, with theS&P 500 returning approximately 15 percent and the Nasdaq 22 percent. Despite day-to-day volatility, capital markets have remained remarkably resilient. Equity markets have shown a healthy appetite for risk, evidenced by Alphabet's $40 billion equity issuance and SpaceX's $85.7 billion IPO. And, investment grade bond markets tell a similar story, absorbing record year-to-date gross issuance of roughly $1.19 trillion, even as spreads remain near historically tight levels, a signal that the market currently perceives little underlying stress.
This resilience is not without foundation. 2026 U.S. real GDP growth expectations continue to outpace other developed economies at 2.1 percent, and corporate profit growth, historically a reliable signal ahead of downturns, remains positive and accelerating, withS&P 500 net profit margins reaching a record 15 percent. This backdrop, supported by the AI infrastructure buildout, a stable labor market, and a resilient consumer, helped drive a standout first quarter reporting season, with year-over-year earnings growth surging by roughly 29 percent, the fastest pace since late 2021.
Yet beneath this confidence, uncertainty lingers. Despite lower oil prices and a new Fed chair, interest rates have yet to fully retrace their year-to-date rise, with markets currently pricing at least one 25 basis point interest rate hike by the end of 2026. Inflation fears have eased alongside oil prices, but inflation remains a long way from the Fed's elusive 2 percent target. At the same time, investors are reassessing the durability and breadth of AI driven growth. What initially appeared to be a narrow, hyperscaler led earnings surge is now being tested by the market's ability to identify the next wave of beneficiaries. As investors look beyond the initial AI infrastructure buildout, attention has shifted to whether the extraordinary capital spending can translate into durable earnings growth across a broader set of companies and use cases. The narrative is evolving from asking how big the opportunity is to asking how sustainable the returns are, a transition that typically marks the shift from early cycle acceleration to mid cycle differentiation.
Heading into the second half of 2026, investor focus is likely to broaden, bringing midterm elections into sharper view alongside crosscurrents spanning AI sentiment, policy, geopolitics, and earnings durability. As such, we anticipate a more complex backdrop, one likely to drive greater dispersion across markets.
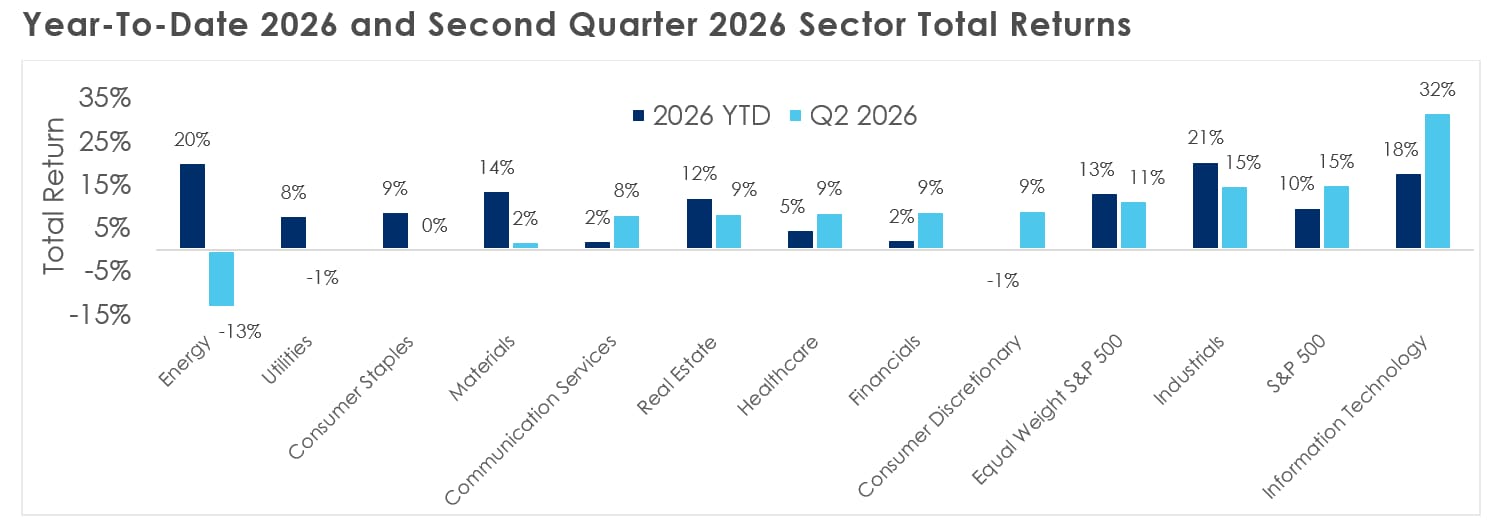
Source: Bloomberg as of June 30, 2026.S&P 500 =S&P 500 Total Return Index; Equal WeightS&P 500 =S&P 500 Equal Weighted USD Total Return Index; Financials =S&P 500 Financials Sector GICS Level 1 Index; Consumer Discretionary =S&P 500 Consumer Discretionary Sector GICS Level 1 Index; Information Technology =S&P 500 Information Technology Sector GICS Level 1 Index; Communication Services =S&P 500 Communication Services Sector GICS Level 1 Index; Healthcare =S&P 500 Healthcare Sector GICS Level 1 Index; Real Estate =S&P 500 Real Estate Sector GICS Level 1 Index; Industrials =S&P 500 Industrials Sector GICS Level 1 Index; Consumer Staples =S&P 500 Consumer Staples Sector GICS Level 1 Index; Utilities =S&P 500 Utilities Sector GICS Level 1 Index; Materials =S&P 500 Materials Sector GICS Level 1 Index; Energy =S&P 500 Energy Sector GICS Level 1 Index.
Compute as the constraint, infrastructure as the opportunity
Technological revolutions rarely arrive all at once. They tend to unfold in phases.
- The first phase is when a new capability proves that something powerful is possible, even if the technology remains narrow, expensive, or difficult to scale.
- The second phase is the infrastructure buildout, when the systems around that technology are developed and allow it to become more useful, accessible, and economically transformative.
Steam power did not reshape the economy through the engine alone. It required railroads, factories, and industrial supply chains. Personal computing followed a similar path. The computer itself mattered, but broader adoption required storage, packaged software, monitors, printers, and eventually networks that made computers practical for everyday work. In both cases, the invention created the possibility, but infrastructure turned that possibility into productivity.
AI seems to be rhyming with the past. The model breakthroughs captured the initial attention, but the current stage is about scaling the technology. The message from major hyperscalers during earnings season was broadly consistent: they are supply constrained, not demand constrained. Alphabet and Microsoft both noted that cloud revenue would have been higher with more compute capacity. When the buyers say they cannot get enough of something, it is often the suppliers that benefit.
What exactly is compute? At its simplest, compute is the horsepower behind AI. It is the processing capacity needed to train models and then run them when people ask questions, generate content, write code, or automate workflows. The amount of compute available depends on how much powered data center capacity exists, how efficiently chips and memory can turn electricity into processing power, and how efficiently AI models use that processing power.
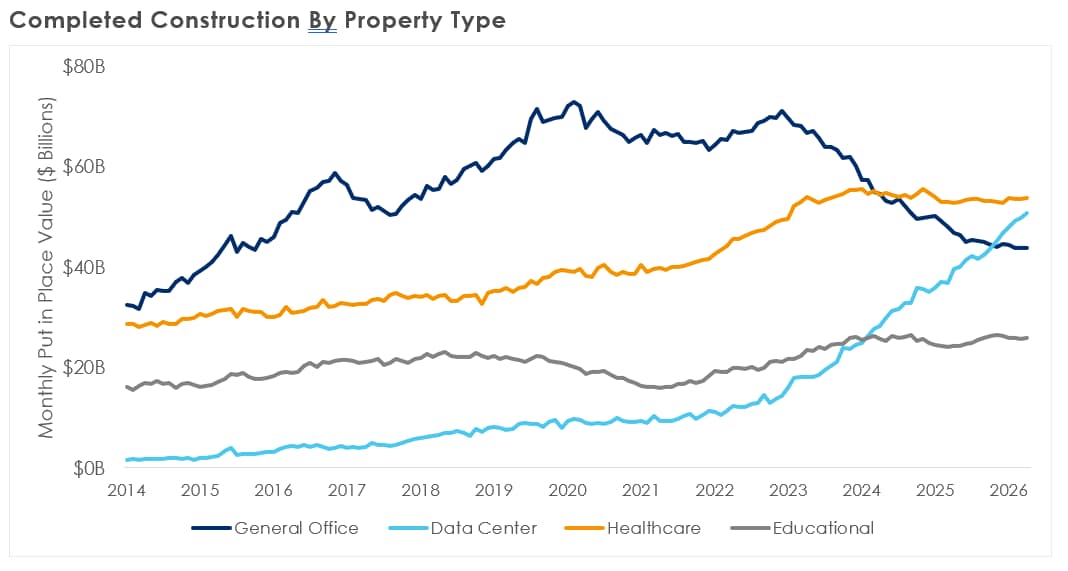
Source: United States Census Bureau as of June 30, 2026.
Capital is flooding into the data center piece of that equation. McKinsey estimates that data centers globally could require nearly $7 trillion of capital expenditures by 2030, with the pace of completed construction already surpassing educational and general office facilities, and closing in on healthcare. At the same time, hardware is becoming more productive per unit of power, and AI models themselves are becoming more efficient. Taken together, Gartner estimates that advancements in hardware, infrastructure, and model design could reduce AI inference costs, or the cost of generating responses after a model has been trained, by more than 90 percent by 2030 compared with 2025.
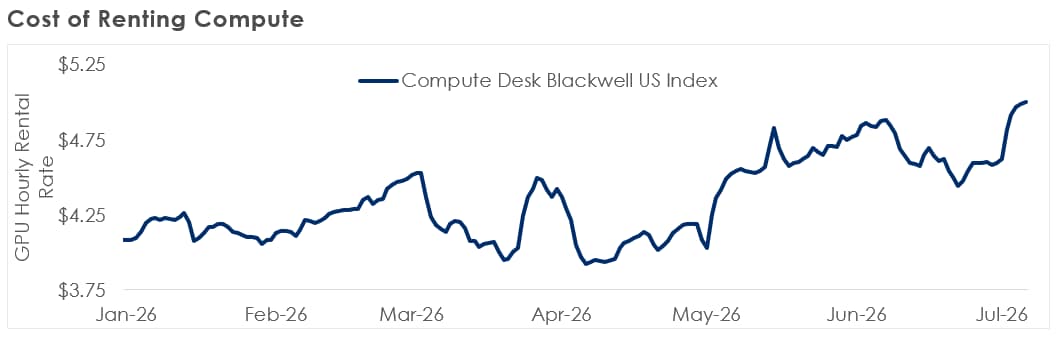
Source: Bloomberg as of June 30, 2026. Note: Compute Desk Blackwell US Index aggregates listed on-demand and reserved prices for renting NVIDIA Blackwell (B200, B300, GB200, GB300) GPUs from U.S. neocloud providers. GPUs, or graphics processing units, are specialized chips that provide much of the computational capacity used to train and run modern AI models.
So, are there risks to overbuilding? Absolutely. It is difficult to know how quickly efficiency gains and demand growth could offset each other, and the ROI debate deserves attention. By some estimates, AI revenue in 2025 was only about 12 cents for every dollar of AI related capex spent, while Barclays estimates that capital investment could absorb nearly every dollar of operating cash flow through 2028. The market seems to expect elevated investment levels to continue. However, if AI inference becomes more embedded in personal and enterprise workflows, usage could expand materially. According to Bank of America, agentic AI workloads could necessitate roughly 10-100x higher token consumption than a standard chat query, and on top of this, less than 0.2 percent of the world is currently using AI in an agentic way. We are still early.
And this is what equity markets have been pricing. The suppliers of scarce inputs have been rewarded. Semiconductors, as represented by the Philadelphia Semiconductor Index, have delivered roughly 102 percent year-to-date total returns through the second quarter, compared with roughly 10 percent for theS&P 500. Much of that strength has been concentrated in a handful of key suppliers as TSMC, Micron, Intel, and AMD alone accounted for nearly $3 trillion of the sector's approximately $5.7 trillion in year-to-date market capitalization gains, a surge that has brought semiconductors to roughly 1.6x the combined size of the MSCI U.S. Consumer Staples and Consumer Discretionary indices.
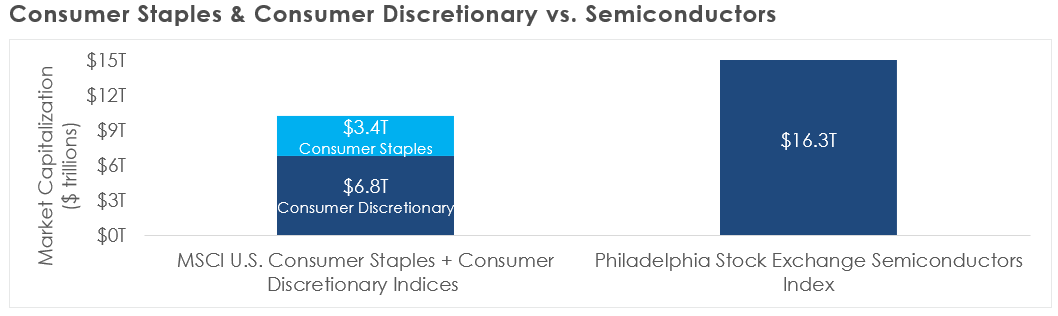
Source: Bloomberg as of June 30, 2026.
If the model breakthroughs marked the first phase, and the infrastructure buildout the second, the next phase of the AI cycle is likely to shift toward applications. Some early areas are already visible, including healthcare, software development, customer service, financial services, and industrial automation.
A few examples:
- Eli Lilly's AI powered drug discovery partnership with Nvidia.
- Tesla's investments in humanoid robotics for healthcare and industrial applications.
- Growing adoption across the property and casualty insurance industry, where AI enabled underwriting and claims workflows have helped firms such as Aetna purportedly reduce processing times by more than 20 percent.
But as with prior technology cycles, many of the most important use cases are likely to be difficult to predict in advance. That is why we continue to view AI as more than simply a software upgrade, but rather analogous to a new industrial platform.
Oil and supply chain resilience
Leading into U.S. involvement in the Middle East conflict, the administration’s primary objectives centered on Iran’s military and nuclear capabilities. But as the four month conflict dragged on, Iran’s clearest leverage increasingly came in the form of cost exchange ratios, or inflicting outsized economic damage at relatively low cost to itself. The most important pressure point was the Strait of Hormuz, a critical energy chokepoint through which roughly 20 percent of the world’s oil supply transits. Once shipping became disrupted, the conflict quickly evolved from a regional military confrontation into a global oil, inflation, and supply chain story.
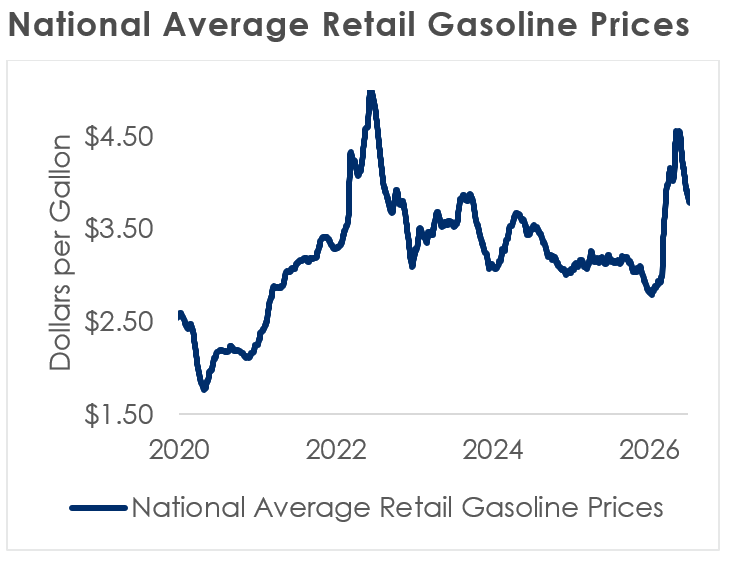
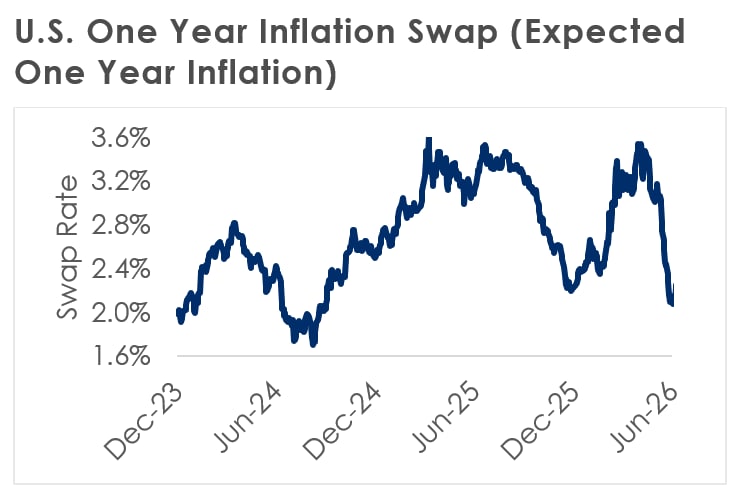
Concurrently with Hormuz disruption, key macro variables moved higher. Oil prices, gasoline prices, and inflation expectations each experienced a meaningful level of change as spot crude quickly moved from roughly $60 per barrel to a peak of almost $113, gas at the pump rose from just under $3 per gallon to roughly $4.50, and one year inflation swaps moved from roughly 2.4 percent to more than 3.5 percent.
While these moves added strain and uncertainty, the more important point was that the economic consequences worsened the longer the conflict dragged on. To cushion the immediate shock, 32 International Energy Agency member countries agreed to make 400 million barrels of emergency oil reserves available to the market, the largest collective release in the agency’s history. As part of that effort, the U.S. authorized a 172 million barrel release from the Strategic Petroleum Reserve, or SPR. But that buffer was finite. Even after the announcement of a broader agreement, the SPR had fallen to roughly 326 million barrels, its lowest level since 1983. The Trump administration warned that the reserve may essentially be tapped out within four weeks. As affordability pressures intensified at home and productivity risks built globally, the incentive to pursue a negotiated off ramp became increasingly clear.
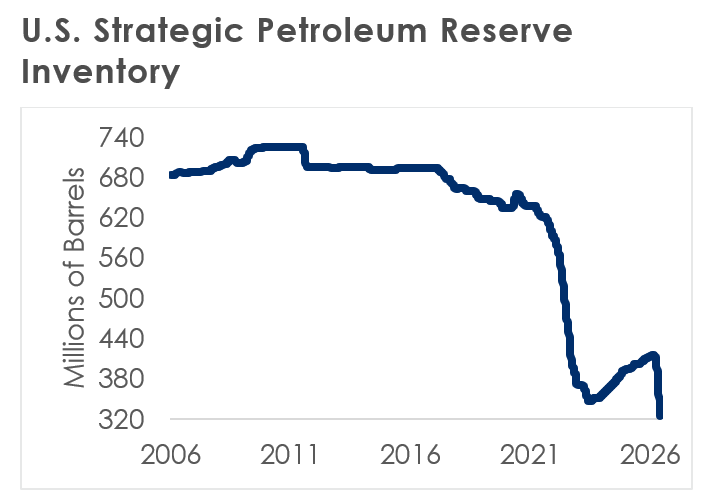
Source: Bloomberg as of June 30, 2026.
Still, the memorandum of understanding, or MOU, signed in mid-June, should not be viewed as final or comprehensive. The agreement created a 60 day window for nuclear negotiations, but did not fully resolve the future of Iran’s enrichment program, its highly enriched uranium stockpile, or the broader missile and proxy questions that had been central to the administration’s original objectives. At the same time, the Hormuz language appears to have bought near term free passage while leaving ambiguity around Iran’s longer term role in managing, regulating, or potentially charging for transit through the Strait. In other words, many of the hardest strategic questions were not resolved; they were deferred to future negotiations.
Recent developments have reinforced that point. Renewed attacks on commercial vessels, U.S. retaliatory strikes, and disputes surrounding sanctions relief and freedom of navigation have placed the agreement under strain, highlighting sensitivity surrounding unresolved questions on Hormuz governance and the broader path toward a permanent settlement.
Source: Bloomberg as of June 30, 2026.
Even so, markets have taken comfort in the possibility that the worst of the shock may be behind us. While the path forward remains uncertain, the same macro variables that moved sharply higher during the conflict have begun to normalize, with spot crude currently sitting at roughly $70–$75 per barrel, gasoline prices easing toward approximately $3.80 per gallon, and one year inflation expectations falling back toward about 2.1 percent–2.2 percent.
Source: Bloomberg as of June 30, 2026.
The broader lesson, however, is not simply that the shock faded, but that shocks expose dependencies and force adaptation. Japan is a useful example. After relying on the Strait of Hormuz for more than 90 percent of its crude imports, it moved aggressively to source July crude entirely from routes outside the Strait, showing how quickly even highly import dependent economies can adjust when critical supply lines are threatened. The trend is broader as well. As with the emergence of tariffs, companies and governments are being pushed to rethink where they source, who they rely on, and how much redundancy they need. The result is not a less connected world, but a more conditional and transactional one, where self sufficiency and control over critical inputs are increasingly valued.
Kevin Warsh wants to take main character energy out of the Fed
The June FOMC marked a notable shift at the Federal Reserve, as the new Chair Kevin Warsh broke from several recent norms. He was the sole participant to not publish a dot plot, significantly shortened the policy statement, deemphasized forward guidance, and launched several task forces, including one focused on the balance sheet. The broader objective appears clear: reduce the Fed's role as a "main character" in markets, so that outcomes are driven less by what the Fed says and more by the data itself. That shift could introduce higher near term volatility as investors lose a familiar anchor, but over time it may foster greater discipline, forcing markets to price a wider range of outcomes rather than lean on Fed guidance or expected support as a crutch.
In this new environment, markets are still trying to read between the lines on rhetoric and tone to glean what Warsh is thinking. Statements such as "deliver price stability" were taken as hawkish; in fact, Bloomberg's natural language processing model showed the post meeting press conference as the most hawkish on record, with almost no dovish language included, and with hawkish levels comparable to 2022, when the Fed was actively hiking. As a result, markets are currently pricing at least one 25 basis point hike through 2026.
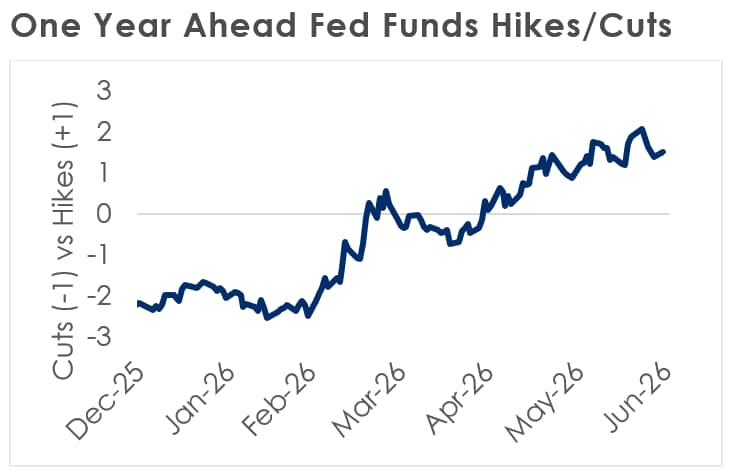
Source: Bloomberg as of June 30, 2026.
But what does the data say? The Fed operates under a dual mandate: maximum employment and stable prices.
On employment, June nonfarm payrolls rose by just 57,000, well short of the roughly 113,000 expected, with April and May revised down by a combined 74,000. Year-to-date payroll additions now total approximately 550,000, a pace that, against a backdrop of slowing population growth from declining birth rates and reduced net migration, looks more like cooling than cracking.
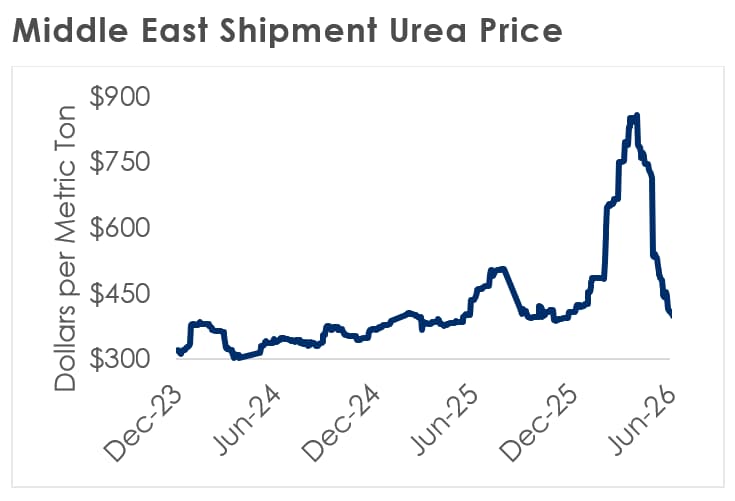
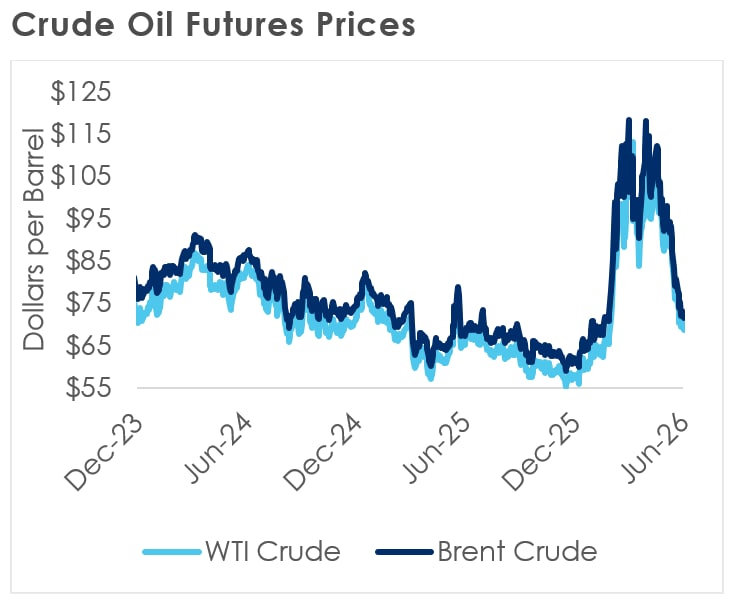
On inflation, CPI rose to 4.2 percent year-over-year in May, but its key drivers are starting to roll over. Oil prices have fallen, pulling fertilizer inputs like urea sharply lower with them. Additionally, rent growth has normalized toward pre-pandemic trends, and wage pressures have eased too. Atlanta Fed median wage growth is back to roughly 3.5 percent, in line with 2010–2020 levels and well below the 6 percent plus pace that accompanied the start of the Fed's last hiking cycle.
Source: Bloomberg as of June 30, 2026.
This combination suggests that the labor market is benign and the inflation impulse may be past its peak, so long as peace holds in the Middle East and oil stays at or below current pricing. If sustained, the next phase is likely to be one of gradual disinflation rather than continued acceleration, especially when taken alongside AI catalysts. Even Chair Warsh himself has described AI as a "hyper Moore's Law," hinting that the pace of AI capability improvement, and thus supply based disinflationary impetus, is accelerating at a steeper, compounding rate. That, in turn, raises some important questions for policy: if inflation is no longer intensifying, is it prudent for the Fed to hike? Are we at "peak hawkishness"? The most likely outcome is a shift from tightening to a more neutral stance. In that environment, the debate shifts from how much further rates need to rise to how long they need to stay where they are.
Source: Bloomberg as of June 30, 2026.
Earnings reality versus bubble rhetoric
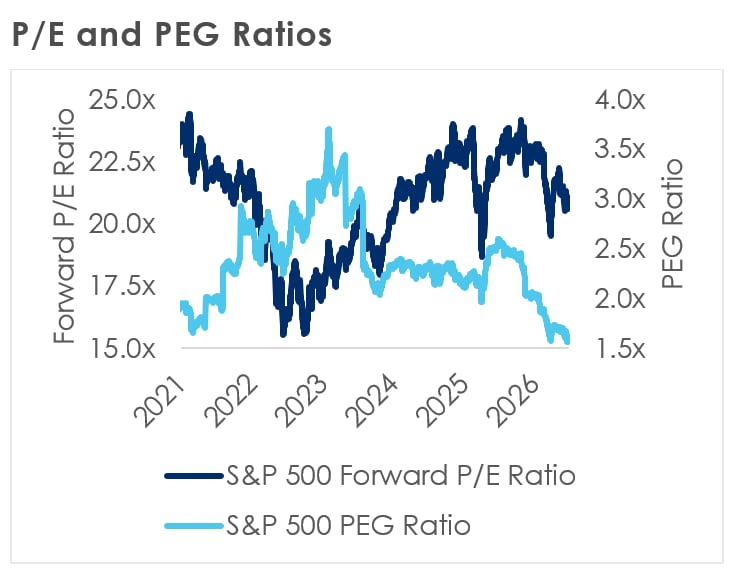
U.S. equity markets’ resilient YTD returns are largely attributable to one factor: earnings. First quarter earnings results handily beat expectations while at the same time 2026 full year earnings estimates were revised markedly higher. Interestingly, earnings growth at this pace (e.g., 25 percent+) is more typical of a post recession recovery than a mid-to-late cycle environment. The upward revision cycle has been underpinned by structural tailwinds, including AI driven capex, improving operating leverage, and sustained pricing power, against a backdrop of a more resilient macro environment than expected. For those citing bubble risks, bubbles are typically characterized by rapid valuation expansion, quite the opposite of today’s market. Although valuations are elevated relative to historical, their expansion has certainly not driven returns.
Source: Bloomberg as of June 30, 2026.
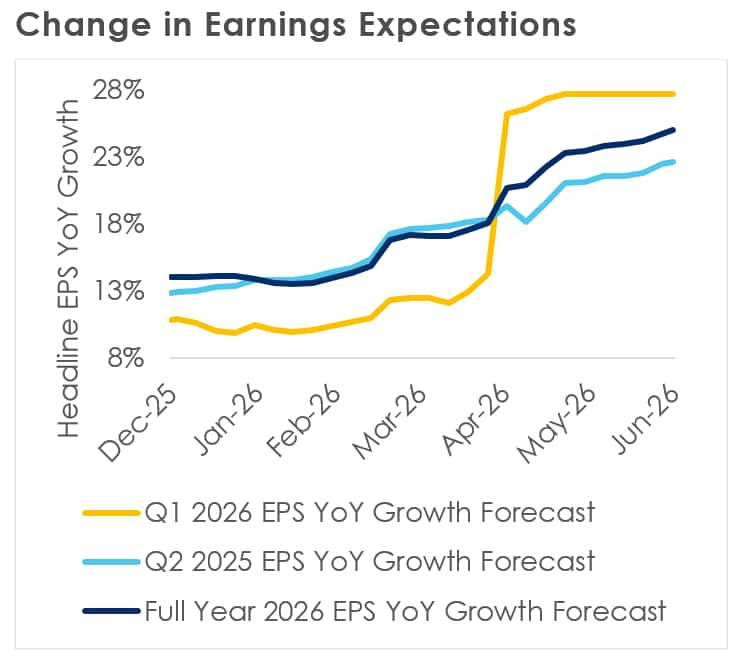
As second quarter earnings season approaches and we enter the back half of 2026, market attention is increasingly shifting to 2027 – particularly the durability of earnings growth and the unprecedented scale of AI driven capital investment shaping it. Street consensus projects robustS&P 500 earnings growth in 2027 of 13–16 percent year-over-year, following an exceptional almost 25 percent surge in earnings expected for 2026. This optimism is underpinned by a historic wave of corporate capital expenditures in AI and related infrastructure. The largest U.S. tech hyperscalers alone are projected to invest roughly $0.9 trillion in 2027, up from approximately $0.75 trillion this year. These enormous investments, already credited with driving roughly half ofS&P 500 earnings growth through 2026–27, provide a powerful structural tailwind.
Source: Bloomberg as of June 30, 2026.
Nevertheless, any deceleration in the pace of capex growth, whether driven by capital discipline or supply constraints, is likely to introduce periodic volatility and prompt a more critical reassessment of the durability of the AI narrative. Indeed, late in the second quarter, we began to see early signs of that dynamic, with weakness emerging in AI hyperscalers, the primary “spenders,” alongside heightened volatility in beneficiary segments such as semiconductors. Importantly, this coincided with a rotation in market leadership, as sectors such as financials, healthcare, and others began to outperform. While index level performance was pressured given the outsized weight of AI linked leaders, the underlying rotation is notable and, in our view, represents a healthier market dynamic that is inconsistent with classic bubble behavior and instead suggests a gradual normalization and diversification of market drivers.
Looking ahead
Investors often say that markets climb a wall of worry. The phrase captures a simple reality in which stocks can continue advancing even as headlines remain dominated by uncertainty. War, inflation, interest rates, geopolitical conflict, elections, recession fears, earnings concerns, and valuation debates each provide reasons for caution. Yet, markets do not trade on today's headlines alone; they trade on expectations for tomorrow.
The resilience observed throughout 2026 reflects that distinction. Despite periods of volatility, investors have largely concluded that corporate earnings will continue to grow, innovation will continue to advance, and the broader economy will remain capable of absorbing shocks. Headlines can create short-term dislocations, but they do not necessarily alter long-term fundamentals. In many cases, they simply create noise around them.
Looking ahead, we continue to believe that the most important investment themes are those tied to adaptation and long-term structural change. The buildout of AI infrastructure, the growing value of energy and supply chain resilience, and the ability of companies to translate technological innovation into operating leverage all remain powerful forces shaping the investment landscape. While uncertainty is likely to remain elevated, and periods of volatility and market rotation should be expected, we continue to focus on long term trends. As such, asset class diversification across sectors and business models positioned to benefit from technological change remains paramount. While early gains have accrued to those enabling the AI ecosystem, we believe the long-term opportunity lies in the broader diffusion of AI across the economy, unlocking productivity, innovation, and value creation across a much wider range of industries.
_______________________________
Disclosures
Market Indices have been provided for informational purposes only; they are unmanaged and reflect no fees or expenses. Individuals cannot invest directly in an index.
|
Description |
|
S&P 500 Total Return Index is calculated intraday by S&P based on the price changes and reinvested dividends of the S&P 500 Index. |
|
S&P 500 Equal Weighted USD Total Return Index is calculated intraday by S&P based on the price changes and reinvested dividends of the S&P 500 Equal Weight Index. |
|
S&P 500 Index is widely regarded as the best single gauge of large-cap U.S. equities and serves as the foundation for a wide range of investment products. The index includes 500 leading companies and captures approximately 80 percent coverage of available market capitalization. |
|
S&P 500 Equal Weight Index includes the same constituents as the capitalization weighted S&P 500, but each company in the S&P 500 EWI is allocated a fixed weight - or 0.2 percent of the index total at each quarterly rebalance. |
|
S&P 500 GICS Level 1 Groups Index is a capitalization-weighted index. The index is designed to measure performance of the broad domestic economy through changes in the aggregate market value of 500 stocks representing all major industries. The index was developed with a base level of 10 for the 1941-43 base period. |
|
S&P 500 Financials Sector GICS Level 1 Index is a capitalization-weighted index based on the Financials Sector group within the S&P 500 GICS Level 1 Groups Index. |
|
S&P 500 Consumer Discretionary Sector GICS Level 1 Index is a capitalization-weighted index based on the Consumer Discretionary Sector group within the S&P 500 GICS Level 1 Groups Index. |
|
S&P 500 Information Technology Sector GICS Level 1 Index is a capitalization-weighted index based on the Information Technology Sector group within the S&P 500 GICS Level 1 Groups Index. |
|
S&P 500 Communication Services Sector GICS Level 1 Index is a capitalization-weighted index based on the Communication Services Sector group within the S&P 500 GICS Level 1 Groups Index. |
|
S&P 500 Healthcare Sector GICS Level 1 Index is a capitalization-weighted index based on the Healthcare Sector group within the S&P 500 GICS Level 1 Groups Index. |
|
S&P 500 Real Estate Sector GICS Level 1 Index is a capitalization-weighted index based on the Real Estate Sector group within the S&P 500 GICS Level 1 Groups Index. |
|
S&P 500 Industrials Sector GICS Level 1 Index is a capitalization-weighted index based on the Industrials Sector group within the S&P 500 GICS Level 1 Groups Index. |
|
S&P 500 Consumer Staples GICS Level 1 Index is a capitalization-weighted index based on the Consumer Staples Sector group within the S&P 500 GICS Level 1 Groups Index. |
|
S&P 500 Utilities Sector GICS Level 1 Index is a capitalization-weighted index based on the Utilities Sector group within the S&P 500 GICS Level 1 Groups Index. |
|
S&P 500 Materials Sector GICS Level 1 Index is a capitalization-weighted index based on the Materials Sector group within the S&P 500 GICS Level 1 Groups Index. |
|
S&P 500 Energy Sector GICS Level 1 Index is a capitalization-weighted index based on the Energy Sector group within the S&P 500 GICS Level 1 Groups Index. |