
Following the extreme volatility and sell-off that ensued after Liberation Day, few could have predicted that the second quarter would not only include a major geopolitical escalation involving U.S. military action in Iran but also include one of the greatest equity market recoveries in history with the S&P 500 reaching new all-time highs.
While surveys continue to reflect subdued consumer confidence and lingering recession concerns, the evolving policy framework under the Trump administration, which has emphasized tariffs, now presents a more measured tone. Coupled with robust underlying economic indicators, this suggests an economy that, although slowing, remains on an upward trajectory.
Even as U.S. equity markets have more than rebounded from the tariff-induced turbulence, concerns persist over foreign demand for U.S. assets — particularly Treasurys — following the passage of “One Big Beautiful Bill,” which is expected to add trillions to an already swelling national debt. Meanwhile, the Federal Reserve remains in a holding pattern, despite mounting political pressure, as the inflationary effects of tariffs remain unclear and economic growth softens, though not enough to warrant an interest rate cut, yet.
As we enter the second half of 2025, a key question is whether the durability of the rally can be maintained amid moderating economic growth, stretched debt and equity valuations, potentially persistent inflation risks, and heightened geopolitical uncertainty, all within a more complex policy and macroeconomic landscape.

Source: Bloomberg as of June 30, 2025.
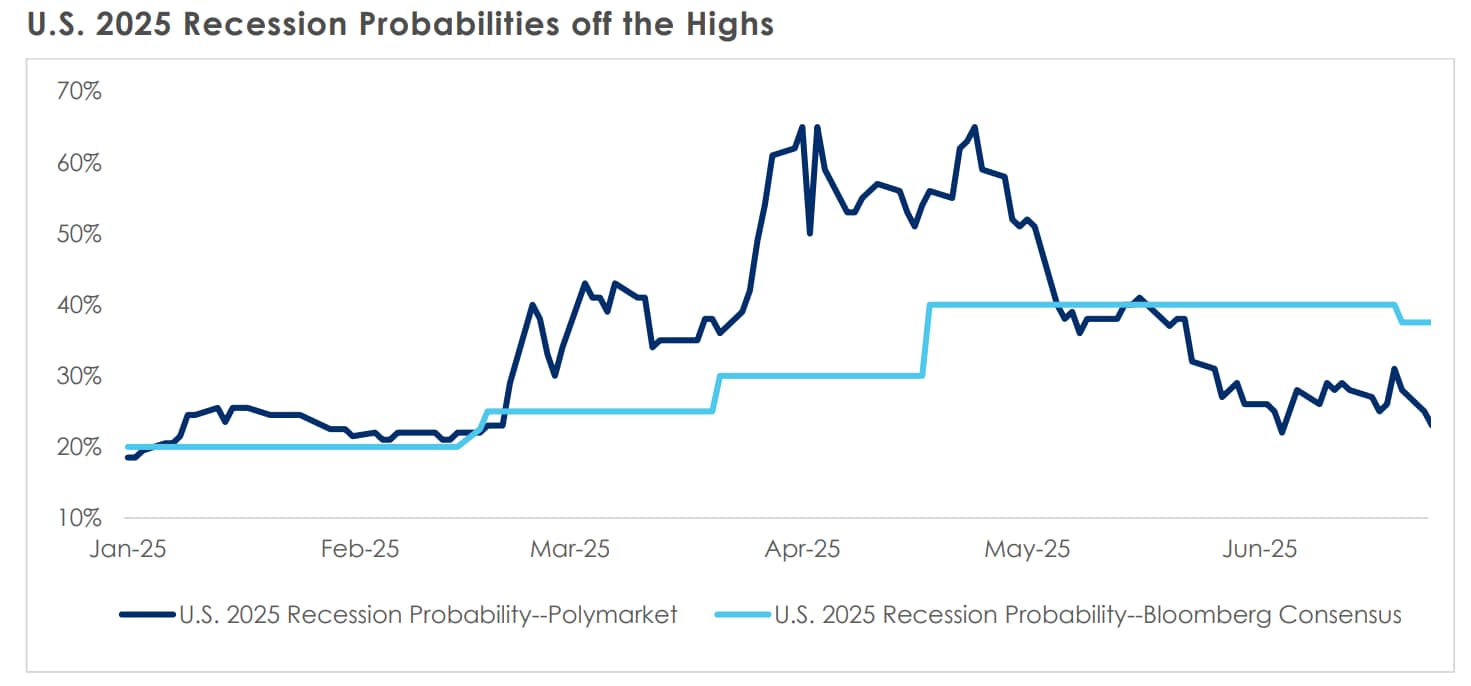
On April 2 the Trump administration unveiled one of the most dramatic overhauls of U.S. trade policy in a century, aimed at jump-starting domestic reindustrialization and narrowing the trade deficit. The sweeping measures, as quantified by JPMorgan, implied an average import tariff of approximately 22 percent, marking the highest rate in over 100 years. Financial markets recoiled: the S&P 500 suffered one of its steepest two-day declines since World War II, the dollar slipped, and Treasury markets swung violently. Fears of an imminent economic downturn took hold as recession probabilities climbed to as high as 60 percent. A few days later, however, the administration announced a 90-day pause—pushing implementation to July 9 (and now August 1) — to allow for negotiations, offering investors a momentary sigh of relief that the worst might be avoided.
Source: Bloomberg & Polymarket as of June 30, 2025.
Tariffs now appear likely to stabilize at levels well above those seen in recent decades, though still below the initial extremes. As this new reality takes hold, both market sentiment and equity performance have shown signs of recovery. Meanwhile, economic data continues to hold up, albeit with a degree of inconsistency that reflects the ongoing crosscurrents like frontloading of purchases and changes in immigration policy.
As we head into the second half of the year, the U.S. economy is projected to grow at a modest pace, although recession risks remain elevated, with economists assigning a 30 percent–40 percent probability. The labor market remains a focal point, as job creation has cooled from its post-pandemic highs. Initial jobless claims are on the rise, and continuing claims indicate people are staying unemployed longer. With both hiring and immigration decelerating, the job market appears broadly balanced, with openings now roughly matching the number of unemployed workers. While the labor market remains stable, we continue to monitor it for signs of an acceleration in layoffs or a rapid slowdown in job growth as we assess the forward growth trajectory. The most recent June payrolls report indicates overall labor market resilience as the unemployment dropped 0.1 percent to 4.1 percent and the U.S. economy added 147,000 jobs.
Equity market U-Turn
On April 8, the S&P 500 fell to its lowest level since April 2024, registering a year-to-date decline of approximately 15 percent, and marking one of the worst starts to a year in history. Investors were gripped by profound fears over the enduring severity of tariffs and the ominous threat of a prolonged trade war.
Concerns centered around:
- Inflation pressures stemming from tariff pass-throughs and potential retaliatory measures.
- Diminishing economic growth due to delayed capital expenditures and reduced consumer spending.
In other words, stagflation.
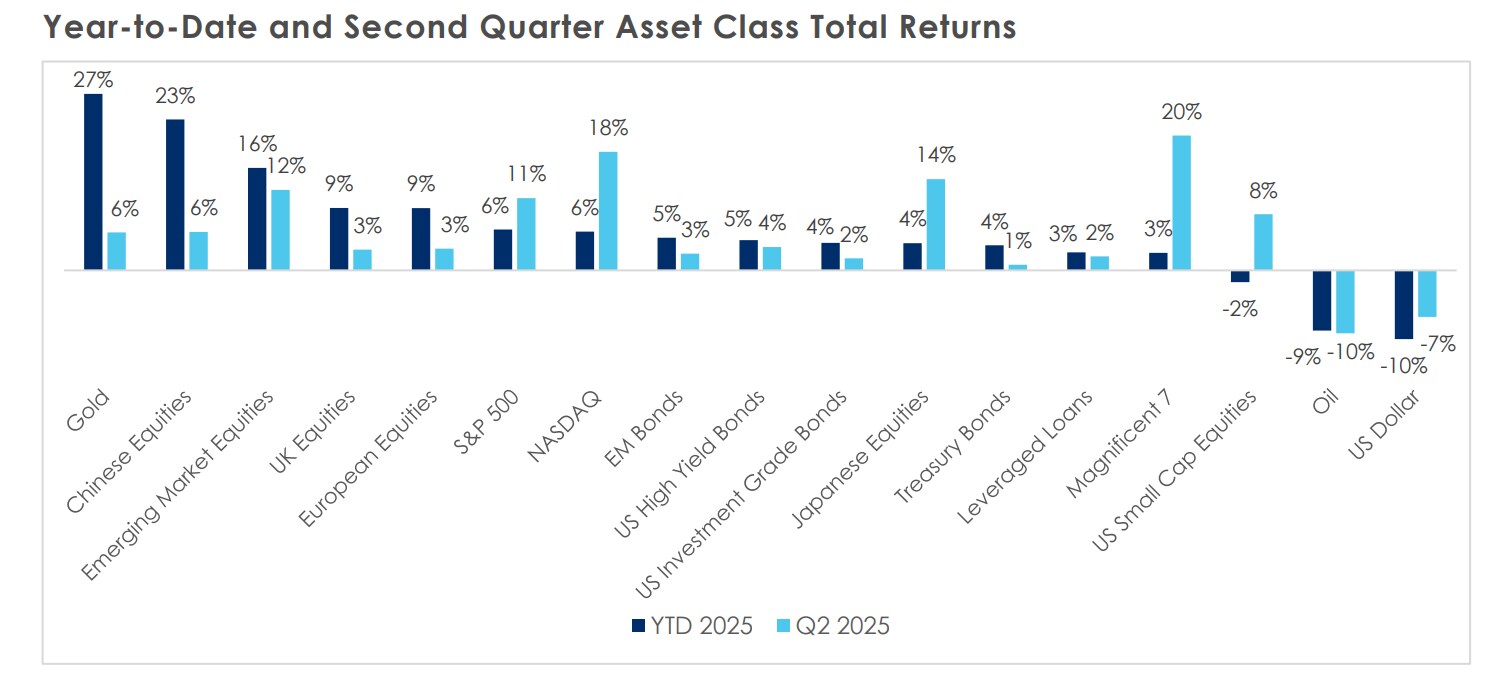
Source: Bloomberg as of June 30, 2025. All indices are measured in Local Currency. Magnificent 7 = UBS Magnificent 7 Index; NASDAQ = NASDAQ Index; S&P 500 = S&P 500 Index; Japanese Equities = Nikkei 225 Index; European Equities = Stoxx 600 Index; US Small Cap Equities = Russell 2000 Index; US High Yield Bonds = Bloomberg US Corporate High Yield Total Return Index; Leveraged Loans = Bloomberg US Leveraged Loan Index; Gold = Gold Spot Price; Oil = Oil Spot Price; US Dollar = U.S. Dollar Index; Emerging Market Equities = MSCI Emerging Markets Index; Emerging Market Bonds = Bloomberg Emerging Markets Aggregate Bond Index; US Investment Grade Bonds = Bloomberg U.S. Corporate Investment Grade Index; Treasury Bonds = Bloomberg US Treasury Total Return Index; Chinese Equities = Hang Seng Index; UK Equities = FTSE 100 Index.
Yet, as the year has unfolded, these initial worst-case-scenario fears gradually subsided. The S&P 500 has since surged, boasting a nearly 5 percent price increase as of the end of June, recovering almost 24 percent from its April low. The second quarter rally marks one of the greatest equity market recoveries in history. But what exactly catalyzed this dramatic shift in expectations and market sentiment?
Contrary to initial fears, tariff levels are expected to stabilize at rates much lower than those proposed on Liberation Day. According to most recent JPMorgan estimates, tariffs fluctuated from about 2.3 percent at the end of 2024 to a peak of 26.2 percent, before dropping back to around 15 percent. While some argue that a double-digit rate is burdensome and unprecedented since the 1940s, the reduction from peak levels has been viewed positively, and the administration continues to negotiate bilaterally with various countries. Nevertheless, with the passage of “One Big Beautiful Bill,” some fear that the administration may be emboldened to take a more hawkish approach to tariffs moving forward.
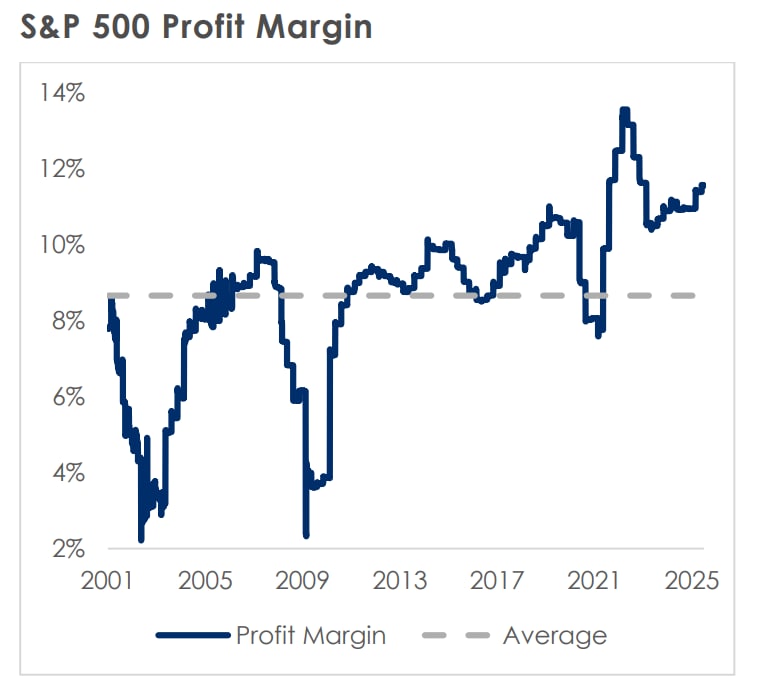
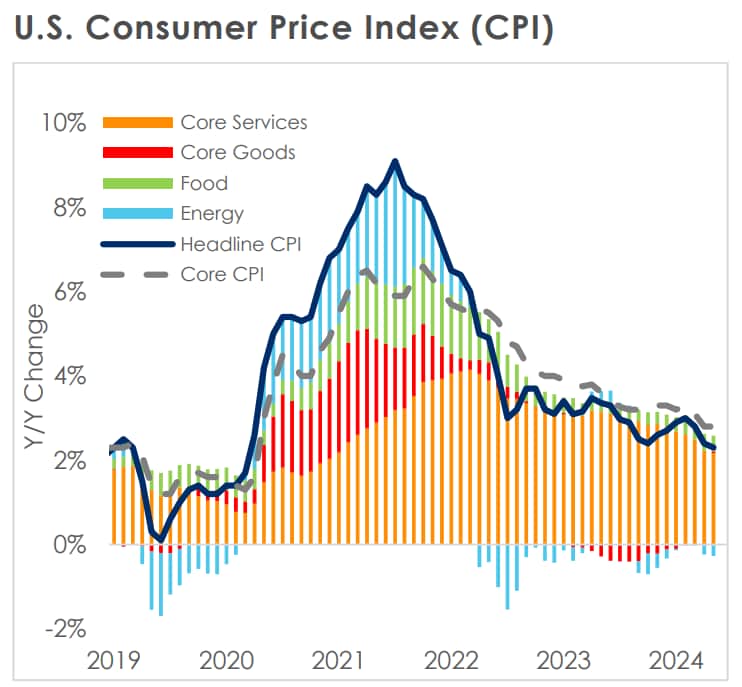
Additionally, inflationary pressures from tariffs have not yet materialized as headline and core CPI have decreased to 2.4 percent and 2.8 percent, respectively. This broadly results from various factors: tariff measures were adjusted with walk-backs and exceptions; AI has increased production efficiency; high S&P 500 profit margins allow companies to absorb higher costs; import frontloading and accumulation of inventories; global supply chains remain diverse; and the Federal Reserve has maintained higher interest rates to control inflation.
Source: Bloomberg as of June 30, 2025.
A closer look at the CPI reveals that the U.S. services sector — accounting for roughly 60 percent of the index — has recently been the primary source of inflation. However, this segment has seen steady disinflation over the year, with its contribution falling from 2.62 percent in January to 2.15 percent, helped by declining rent growth.
On the goods side, pass-through pricing effects are clearly visible, though their overall impact on inflation remains modest, given goods account for only about 40 percent of the CPI. As a result, their contribution has risen only slightly—from -0.019 percent to 0.068 percent. Tariffs affect goods more directly and immediately due to tighter profit margins and a strong dependency on imported raw materials. In contrast, services experience more lagged and diffuse effects, with input costs like machinery unfolding over time, and most inflationary pressure emerging through wages and expectations.
Source: Bloomberg as of June 30, 2025.
Finally, consumption and spending appear steady, with further catalysts likely via fiscal stimulus. Earnings season in the first quarter was strong as S&P 500 earnings per share surprised positively by 7.6 percent, compared to an average of 5.9 percent over the past four quarters, and broadly AI-related capital expenditures were reaffirmed. Second quarter earnings per share are expected to grow approximately 5 percent, led by the communications services and technology sectors. Moreover, “One Big Beautiful Bill,” despite potential debt and deficit concerns, promises immediate market stimulus through tax cuts, credits, capex expensing, R&D incentives, and regulatory rollbacks.
Balancing stimulus with a heavier debt load
“One Big Beautiful Bill,” a centerpiece of investor attention alongside tariffs, has been signed into law. This sweeping legislation not only makes the 2017 Trump tax cuts permanent, but also introduces additional relief measures, including federal tax exemptions on portions of tips and overtime pay, and full expensing for new factories and equipment. While these measures are partially offset by reductions in Medicaid, food assistance programs, and clean energy subsidies, the broader fiscal burden is expected to remain significant.
On one hand, the bill is stimulative, meaning it supports economic growth through tax cuts, tax credits, and business incentives. On the other hand, the bill is expected to add about $3.3 trillion to an already ballooning national debt. To put recent trends into perspective, it took the United States two centuries to rack up its first $12 trillion of debt; we've added another $12 trillion in just the past four years through relentless deficit spending. Reflecting these pressures, Moody's stripped the U.S. of its last AAA credit rating this quarter, citing bipartisan inaction on revenue increases and spending restraint.
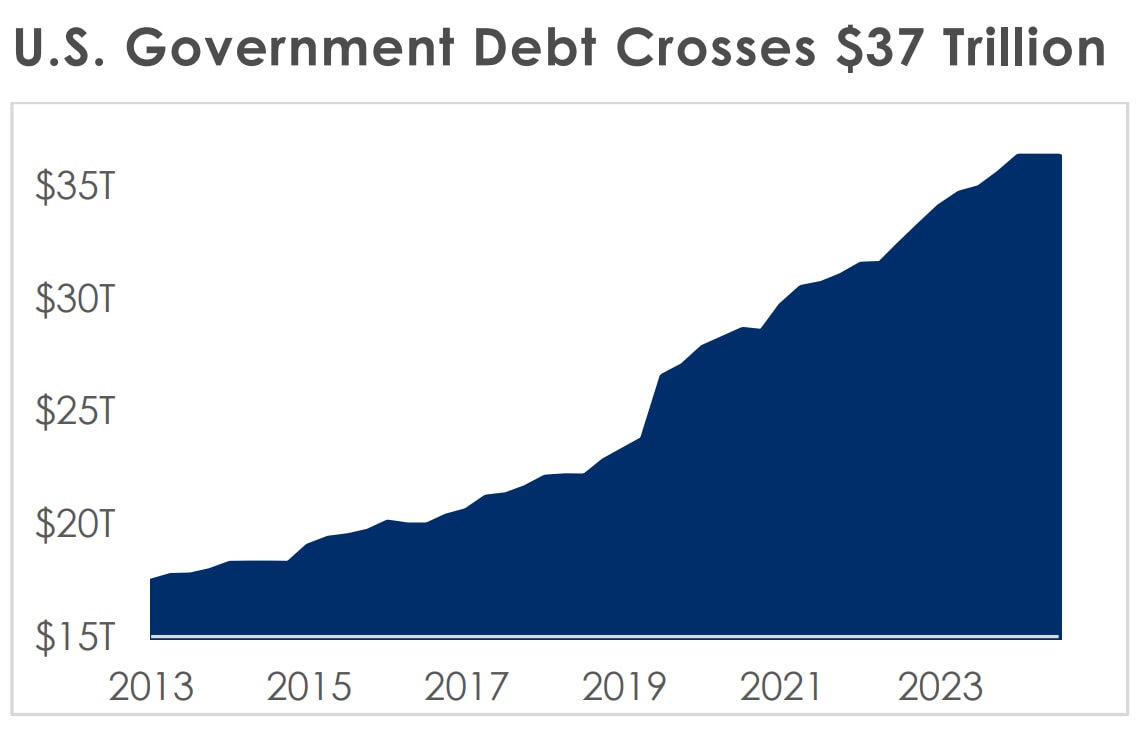
Source: Bloomberg & usdebtclock.org as of June 30, 2025.
The situation brings to mind the poignant fiscal policy controversies during Liz Truss’ brief 45-day tenure as Prime Minister of the United Kingdom in late 2022. Truss introduced a fiscal package with substantial tax cuts, but the market response was overwhelmingly negative. The UK already faced high inflation and elevated debt levels, and the uncosted nature of the announcement exacerbated the market's concerns. The result was a sharp decline in the British pound, soaring government bond yields, stressed pensions, and significant political fallout. It raises the question of whether, down the line, the U.S. might encounter a similar "bond tantrum" due to analogous policy decisions.
Why does U.S. government debt exceeding 120 percent of GDP matter?
• Rising Interest Costs: Interest payments now exceed $1 trillion annually—more than the entire defense budget
• Crowding Out Private Investment: Heavy Treasury issuance can push up yields, making borrowing more expensive for businesses and consumers. We’ve already seen bouts of market volatility tied to weaker auctions and expansionary fiscal plans
• Reduced Crisis Flexibility: In the COVID-19 downturn, ample fiscal firepower enabled historic relief packages. With deficits and debt so elevated today, future emergencies—whether recessions, pandemics, or natural disasters—will meet a far more constrained federal balance sheet
Taken together, the new bill’s growth boost comes with a steep trade-off: powerful short-term stimulus at the cost of mounting long-term risks.
All roads lead to the Fed
Movements in interest rates this year have largely reflected two things:
- A slowing growth backdrop.
- The expectation that the Federal Reserve will eventually resume its easing cycle.
The Treasury curve has steepened year-to-date with the 2-year Treasury yield dropping 52 basis points and the 10-year Treasury yield dropping 34 basis points.
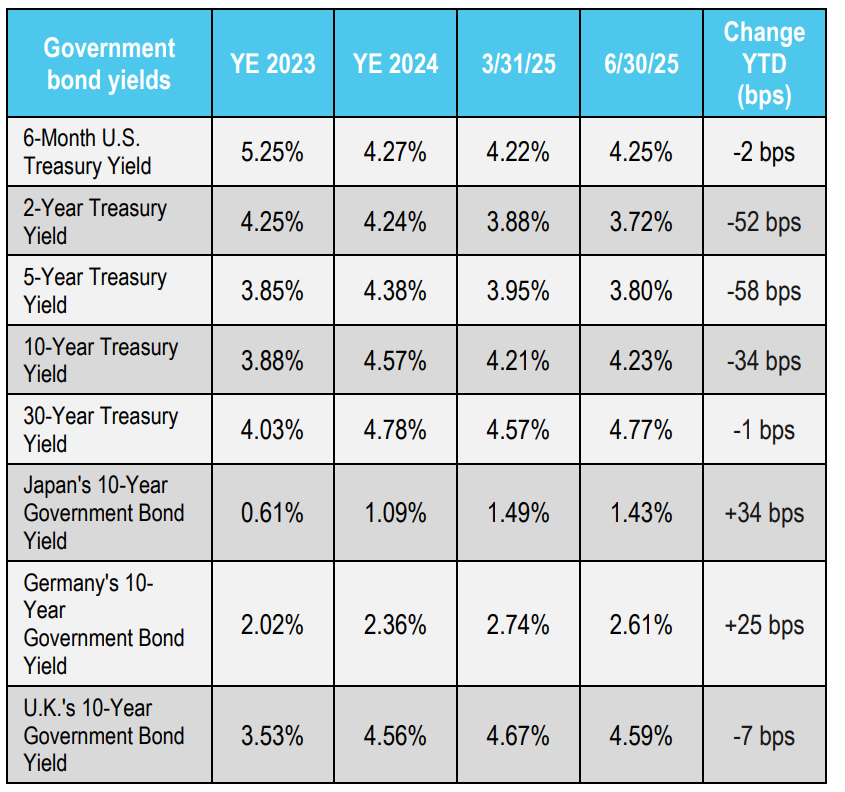
Source: Bloomberg as of June 30, 2025.
Although market pricing reflects an expectation that the Fed will cut short-term rates approximately 50 bps this year beginning in September, it is no guarantee that it’s the trajectory they will follow as the market has repeatedly misjudged future Fed moves.
At present, the Federal Reserve is “on hold,” unlikely to cut interest rates this month, citing concerns over the potential long-term inflationary effects of tariffs, which have yet to appear in backward-looking figures, along with the short-term inflationary effects of fiscal stimulus from the “One Big Beautiful Bill,” and a still resilient labor market.
President Trump has expressed disagreement with Federal Reserve Chair Jerome Powell’s firm stance, calling him “too late” and publicly suggesting that a replacement might be announced before the end of Powell’s term in May 2026. Markets have largely coalesced around the idea that Powell’s successor will adopt a more dovish approach, leading to a continued decline in the U.S. dollar and benefiting stocks as expectations for interest rate cuts have been moved forward.
As we look out over the second half of the year, we continue to pay close attention to the evolving economic backdrop, which will inform the Fed’s decisions and market trajectory. Based on the “hard data,” companies and consumers have thus far weathered the storm, though their attitudes and sentiment might not reflect as much. Equity and corporate bond valuations remain historically elevated, but that may be justified given the demonstrated resilience of the economy, sustained margin strength, market concentration in high-performing companies with above-average earnings and revenue growth, and the expanding potential for exponential innovation as AI adoption accelerates.
_________________________
Disclosures
Market Indices have been provided for informational purposes only; they are unmanaged and reflect no fees or expenses. Individuals cannot invest directly in an index.
|
Description |
|
The UBS Magnificent 7 Index tracks a group of 7 of the largest mega cap tech stocks listed in the US. The stocks mirror their respective S&P 500 weight reweighted pro-rata. |
|
The NASDAQ Composite Index is a broad-based capitalization-weighted index of stocks in all three NASDAQ tiers: Global Select, Global Market and Capital Market. |
|
The S&P 500 Index is widely regarded as the best single gauge of large-cap U.S. equities and serves as the foundation for a wide range of investment products. The index includes 500 leading companies and captures approximately 80% coverage of available market capitalization. |
|
The Nikkei-225 Stock Average is a price-weighted average of 225 top-rated Japanese companies listed in the First Section of the Tokyo Stock Exchange. The Nikkei Stock Average was first published on May 16, 1949, where the average price was ¥176.21 with a divisor of 225. |
|
The STOXX Europe 600 Index is derived from the STOXX Europe Total Market Index (TMI) and is a subset of the STOXX Global 1800 Index. With a fixed number of 600 components, the STOXX Europe 600 Index represents large, mid and small capitalization companies across 17 countries of the European region. |
|
The Russell 2000 Index is comprised of the smallest 2000 companies in the Russell 3000 Index, representing approximately 8% of the Russell 3000 total market capitalization. The real-time value is calculated with a base value of 135.00 as of December 31, 1986. The end-of-day value is calculated with a base value of 100.00 as of December 29, 1978. |
|
The Bloomberg US Corporate High Yield Bond Index measures the USD-denominated, high yield, fixed-rate corporate bond market. Securities are classified as high yield if the middle rating of Moody's, Fitch and S&P is Ba1/BB+/BB+ or below. Bonds from issuers with an emerging markets country of risk, based on Bloomberg EM country definition, are excluded |
|
The Bloomberg US Leveraged Loan Index measures the performance of USD denominated, high-yield, floating-rate, institutional leveraged loan market. The US Loan Index was created in 2024, with history backfilled to January 1, 2019. |
|
Oil Spot Price is quoted as dollars per barrel for export quality Brent crude oil. |
|
Gold Spot Price is quoted as dollars per Troy Ounce. |
|
The U.S. Dollar Index (USDX) indicates the general international value of the USD. The USDX does this by averaging the exchange rates between the USD and major world currencies. The ICE US computes this by using the rates supplied by some 500 banks. |
|
The MSCI EM (Emerging Markets) Index is a free-float weighted equity index that captures large and mid-cap representation across Emerging Markets (EM) countries. The index covers approximately 85% of the free float-adjusted market capitalization in each country. |
|
The Bloomberg Emerging Markets Hard Currency Aggregate Index is a flagship hard currency Emerging Markets debt benchmark that includes USD-denominated debt from sovereign, quasi-sovereign, and corporate EM issuers. |
|
The Bloomberg US Corporate Investment Grade Index measures the investment grade, fixed-rate, taxable corporate bond market. It includes USD denominated securities publicly issued by US and non-US industrial, utility and financial issuers. |
|
The Bloomberg US Treasury Index measures US dollar-denominated, fixed-rate, nominal debt issued by the US Treasury. Treasury bills are excluded by the maturity constraint but are part of a separate Short Treasury Index. STRIPS are excluded from the index because their inclusion would result in double-counting. |
|
The Hang Seng Index is a free-float capitalization-weighted index of a selection of companies from the Stock Exchange of Hong Kong. The components of the index are divided into four subindices: Commerce and Industry, Finance, Utilities, and Properties. The index was developed with a base level of 100 as of July 31, 1964. |
|
The FTSE 100 Index is a capitalization-weighted index of the 100 most highly capitalized companies traded on the London Stock Exchange. The equities use an investibility weighting in the index calculation. The index was developed with a base level of 1000 as of December 30, 1983. |
Past performance is no guarantee of future performance or market conditions. Investing involves risk including the possible loss of principal. Investment return and principal value will fluctuate so that when sold may be worth more or less than the original cost.
Use of political figures or statements is solely for reference and relevance to financial markets and is not meant to be an endorsement or a reflection of the company’s opinion or position.
This material is intended for informational purposes only and does not constitute a recommendation to engage in or refrain from a particular course of action. The information within has not been tailored for any individual and is not intended as tax, legal or investment advice.
The views and opinions expressed are those of the author as of the date of the writing and are subject to change without notice. Although the information has been gathered from sources believed to be reliable, it is not guaranteed. Please note that individual situations can vary, therefore, the information should be relied upon when coordinated with individual professional advice. Clients must rely upon his or her own financial professional before making decisions with respect to these matters.
This communication may include forward-looking statements or projections that are subject to certain risks and uncertainties. Actual results, performance, or achievements may differ materially from those expressed or implied.
Investments discussed may have been held in client accounts as of June 30, 2023. These investments may or may not be currently held in client accounts.