
The second quarter delivered positive returns for investors across almost all major asset classes. Global equities have continued to make new highs, led by the Artificial Intelligence (AI) revolution in the U.S. While consumer and business sentiment has sunk lower throughout the quarter, the narrative for stocks and bonds has been hard to describe as anything but optimistic.
The fundamental supports have all held in:
- The economy is growing.
- Corporate earnings are strong.
- The U.S. labor market is creating still-plentiful jobs.
- Household wealth continues to reach new records.
June marked the seventh winning month out of the past eight for the S&P 500, bringing year-to-date total returns to approximately 15 percent. There are now officially three U.S companies with equity market capitalizations over $3 trillion. Without question, it’s a bull market, but the probability of something going awry is rising. Specifically, signs are mounting for the Fed that restrictive monetary policy is influencing the economy, consumer spending is slowing, and concerns are rising over the political environment as the presidential election approaches.
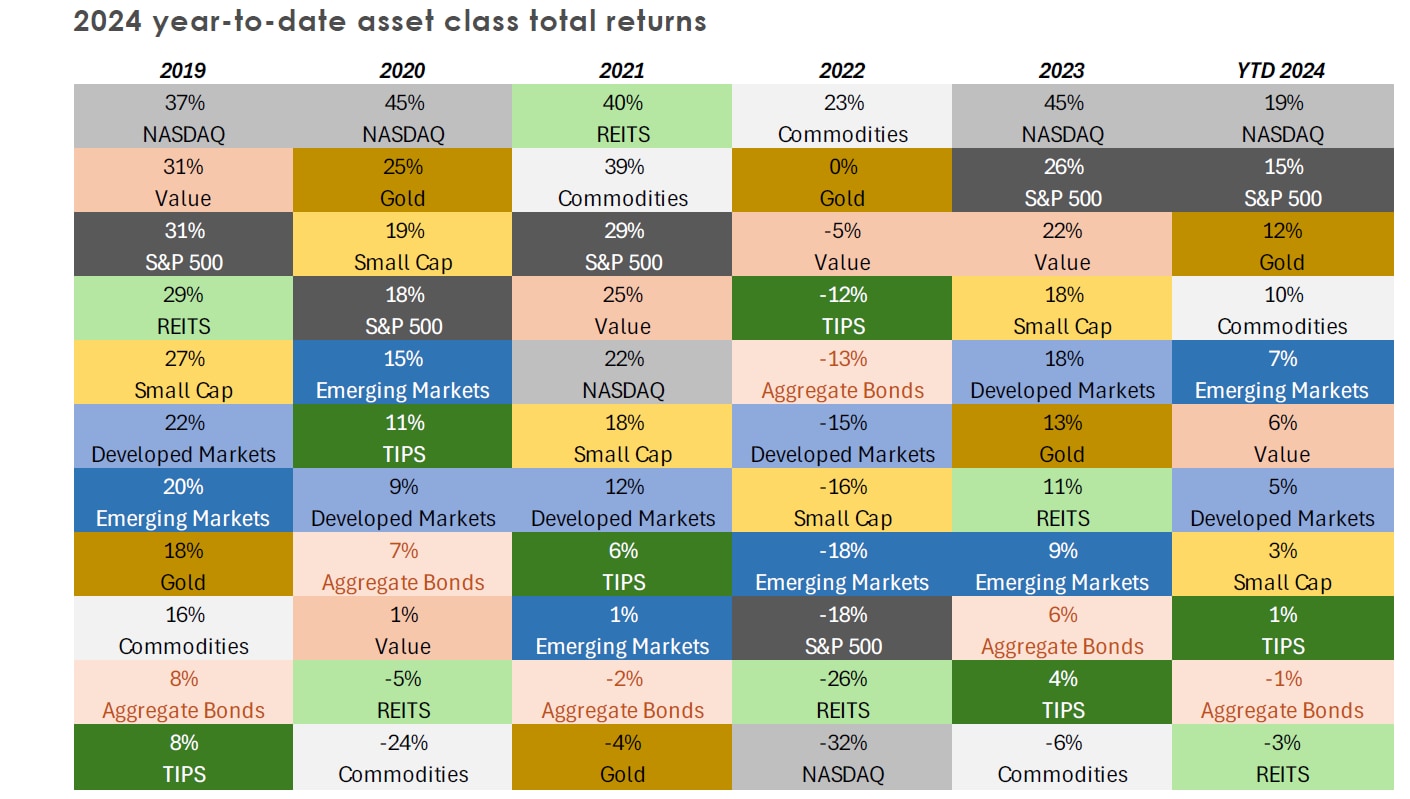
Source: Bloomberg as of June 30, 2024.1
Equities and credit
Despite a strong first half of the year for equities, forward outlooks are mixed. Some investors believe the unprecedented growth of AI, ebbing inflation, and strong corporate earnings will drive upside, while others see eerie parallels to the 1999 tech bubble.
Taking the more pessimistic view first, like the 1999 tech bubble, the market is driven by technology stocks, is highly concentrated, and has a large gap between market cap weights and earnings. In particular, S&P 500 returns are skewed by the top 10 weights, which account for 77 percent of the year-to-date appreciation, mainly from tech giants such as Microsoft, Apple, Nvidia, Amazon, and Meta. Nvidia alone has contributed more than 30 percent to year-to-date appreciation. In fact, the top three mega-cap companies are now equivalent in size to 21 percent of the entire S&P 500 index market capitalization. The disparity between market caps and earnings of the top ten S&P constituents is also unprecedented, with these companies making up 35 percent of the S&P weighting while only contributing 23 percent in earnings. This raises questions about both sustainability and valuations.
On the other hand, the underlying rate environment, volatility, and broad market P/E ratios are much more favorable than those seen in prior bubble eras. The low-rate environment of 1999 spurred risk-taking and speculation due to cheaper capital. In contrast, today’s environment is more driven by optimism surrounding underlying fundamentals, economic growth, and the expectation for interest rate cuts. In fact, the consensus estimate for full-year 2024 S&P 500 earnings growth is 11.3 percent. Earnings grew just 1.0 percent in 2023. While current valuations may seem rich when focusing on the chunkiest constituents, the overall S&P 500 forward P/E ratio is around 21 times today, versus 25 times during the tech bubble.
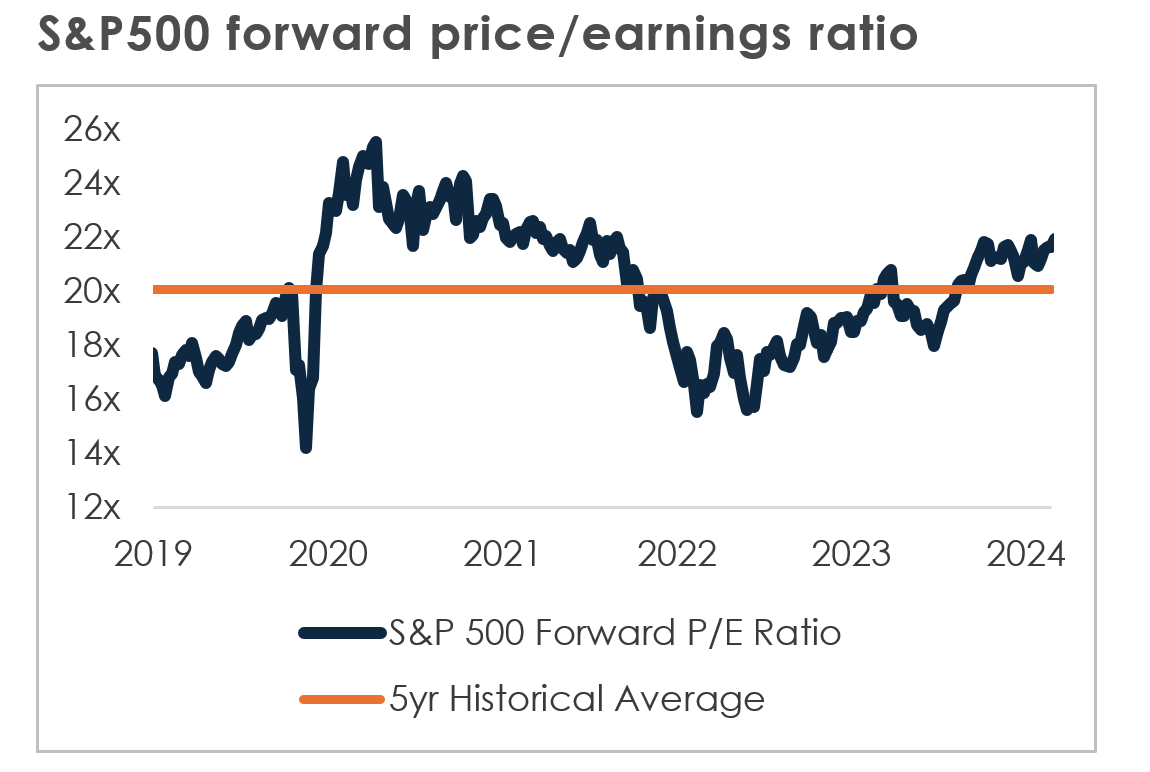
Source: Bloomberg as of June 30, 2024.
Pivoting to credit markets, the year-to-date backdrop has been characterized by:
- An unusual mix of higher treasury yields.
- Higher than expected corporate debt issuance.
- Tighter corporate bond spreads.
Treasury yields have experienced upward moves across the yield curve of about 50 basis points since the start of the year as expectations for interest rates cuts have been dialed back.
The sustained tight levels of credit spreads are being driven by attractive all-in yields and strong underlying fundamentals resulting in high demand for bonds. Yields are slightly below 2023 peaks but are still at some of the highest levels seen in the past decade. Specifically, the investment grade corporate index is yielding around 5.5 percent while the high yield corporate index is around 8 percent. Also, investment grade corporate credit and high yield spreads have sustained levels near or below 100bps and 315bps, respectively, compared to their respective historical averages of 150bps and 525bps. This is evidently a signal of how expensive the asset class appears to investors on a historical basis, but also demonstrates the strength of the markets and ability for issuers to access this attractively priced debt capital.
Fed and the economy
The U.S. economy cooled more than expected in the first quarter of the year, with GDP growing at a 1.6 percent annualized rate (versus 3.4 percent in the fourth quarter) but remained healthy by historical standards. On a relative basis, the U.S. is far outpacing peers. Economists now expect full-year growth of 2.3 percent, more than tripling the expectation for the Eurozone’s 0.7 percent.

Source: Bloomberg as of June 30, 2024.
Market expectations have been on somewhat of a roller coaster ride starting the year with anticipation for six interest rate cuts, and now projecting just two twenty-five basis point cuts for the remainder of the year. According to Federal Reserve Chairman Jerome Powell, the U.S. is back on what he calls “a disinflationary path”. This claim is supported by the Core Personal Consumption Expenditure (PCE) Index, the Fed’s preferred inflation measure, which rose just 2.6 percent year-over-year in May. This was the lowest month since March 2021. The Fed is keeping a careful eye on warning signs that the real economy is weakening. This includes the fact that the unemployment rate, while still low by historical standards, has risen steadily from 3.4 percent in April of 2023 to 4.1 percent as of June. As we have commented on in the past, consumers have also run their pandemic-era excess savings dry. As such, it should come as no surprise that this has started to show up in earnings calls, with consumer behemoths like Starbucks citing slower foot traffic, and McDonalds seeing sluggish sales in the first quarter.
Europe, in an objectively weaker economic position than the U.S., saw the European Central Bank take the first interest rate cut action of the major central banks at their June meeting, opting for a 25-basis point reduction. In the U.S., the consensus call is for the first reduction to take place in September.
Government debt / election
The June debate between President Joe Biden and former President Donald Trump was the first of the 2024 election cycle and the earliest presidential debate in U.S. history. Inflation, immigration, and the economy are top of mind issues for the upcoming election.
Government spending is a central tenet in all these issues. The national debt reached a record high of $34.9 trillion in June, equivalent to 122 percent of the gross domestic product (GDP) of the country. There’s been an intense amount of focus on how the elections could further move the fiscal needle. Arguing about which party is to blame for the debt avoids an important truth: both Democrats and Republicans are at fault for our increasingly overextended fiscal position; about two-thirds of the total national debt has been incurred since 2001.
The post-pandemic government spending that we have seen is a double-edged sword. On the positive, we have effectively spent our way out of incurring a recession. Annual deficit spending at a level equal to 7 percent of GDP with the economy running at full employment is a statistical outlier and is highly unusual. However, concerns associated with how to pay for this year’s nearly $2 trillion deficit — which briefly captured market participants’ attention last fall — will likely come back. Longer-term treasuries are likely to be most vulnerable as uncertainty about our debt sustainability mounts.
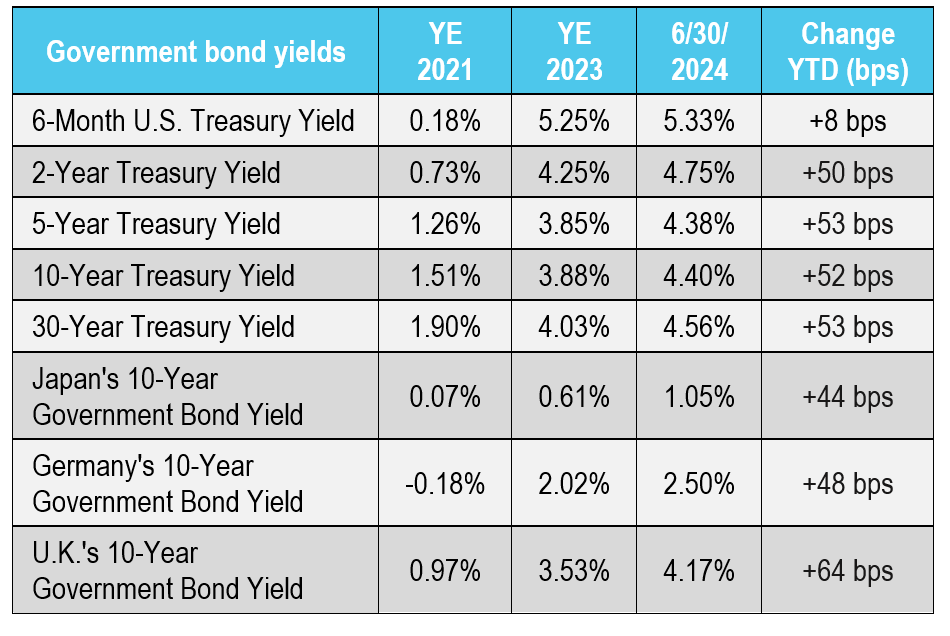
Source: Bloomberg as of June 30, 2024.
Labor market and immigration
The U.S. economy has not only avoided a downturn, but also greatly surpassed the growth of other countries and even predictions for its own expansion. This is largely due to the strong performance of the labor market, as the data shows. In the first half of the year, the U.S. added an average of 264,000 jobs per month, or about 63,000 more jobs per month than expected. This stunning growth raises questions when looking under the surface. Indicators derived from the official government reports, namely payrolls and wages reports, have been stronger than expected; however, indicators from household surveys, like the unemployment and labor force participation rates have been worse than expected.
The reason for this? Many economists now believe that the impacts of immigration have been seriously underestimated.
Being an election year, immigration has sharply come into focus with 36 percent of voters citing it as a top concern in the upcoming presidential election. Between 2014 and 2019, immigration remained relatively stable, with flows averaging approximately one million people per year. Last year however, the U.S. experienced a record high net gain of 470,000 foreign-born in December 2023, and four million throughout the full year. Per Barclays, foreign-born people represent around 20 percent of total employment in the U.S. but accounted for about 75 percent of the increase in private sector employment over the past year. Despite the political controversy, this post-pandemic surge in immigration has had positive effects on the U.S. economy, such as easing labor shortages and the associated inflationary pressures. It is key to remember that consumer spending accounts for more than two-thirds of GDP, and when more people have jobs, they can spend more and boost the economy.
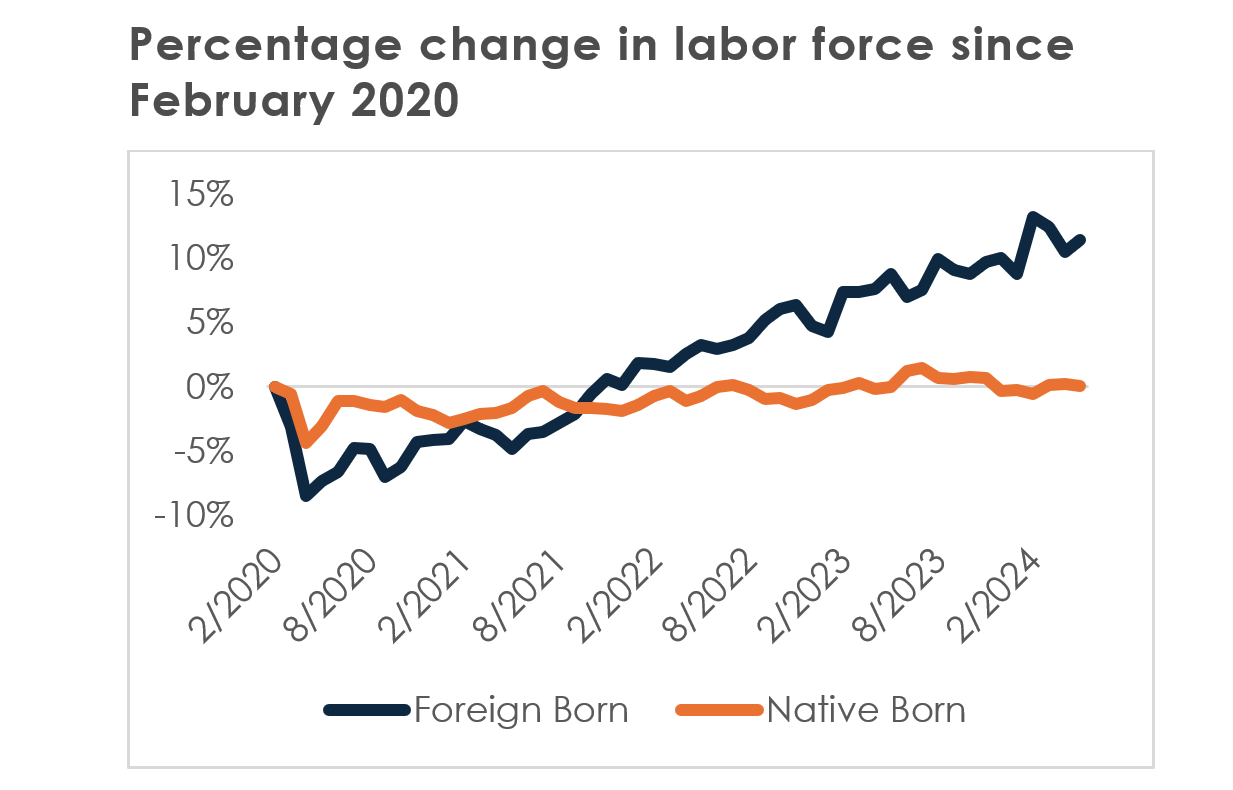
Source: Apollo as of June 30, 2024.
Looking ahead
As we enter the second half of the year, it appears as if fundamental drivers of the economy have moved closer to the Fed’s 2 percent inflation target. Price and wage growth have slowed, while employment has remained at historically strong levels. When the economy is growing, and earnings are growing, that typically creates a positive backdrop for markets. However, prudent investors may consider the following: the 25-year average intra-year drawdown of the S&P 500 has been 16 percent, and we have seen a mere 6 percent over the first half of the year.
Looking to the imminent horizon, the second quarter earnings season and outlook will be a key driver of market sentiment, especially for the big banks and the tech sector. We remain more cautious now given market concentration, elevated valuations, and rising political and trade risks. As always, we encourage you to speak with a MassMutual financial professional to help you plan your future.
_____________________________________