
After a year defined by risk asset resilience and easing financial conditions, the opening months of 2026 greeted investors with dystopian AI narratives, war in the Middle East choking off a vital artery for oil and gas trade, and a drastic recalibration in Federal Reserve policy expectations. Furthermore, the unwind in highly valued software and growth equities highlighted how sensitive asset prices have become to discount rates, cash flow visibility, and AI narratives. What was expected to be a year of continued monetary easing, broadening growth supported by fiscal policy, and favorable financial conditions could be shaping up to be one with commodity driven price pressures, geopolitical challenges, tighter financial conditions, and dented aggregate demand.
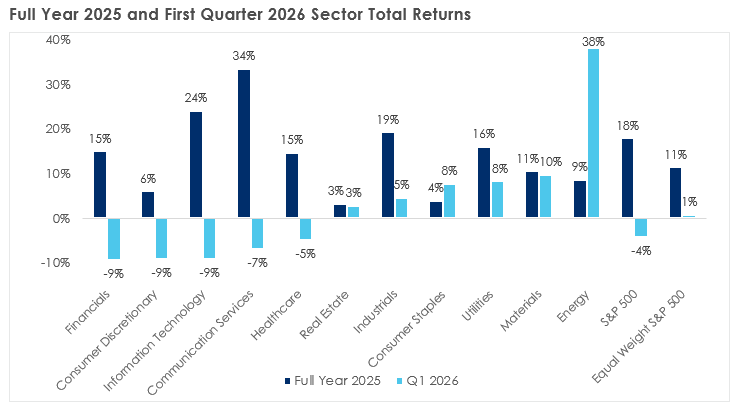
Still, U.S. equity markets delivered a modestly negative total return for the quarter, indicating that investors, while acknowledging elevated geopolitical risk, continue to price in eventual de-escalation and a return to a more stable global operating environment. Treasury yields have moved sharply higher but remain within their one year range as investors assess the persistence of higher oil prices and their second and third order impacts on costs and demand. Beneath the surface, equity markets have seen pronounced dispersion and rotation with investors shunning technology, consumer discretionary, and financials, while embracing energy, materials, and utilities.
Taken together, the first quarter of 2026 underscored a transition away from broad, liquidity driven gains toward a more selective and risk aware environment. For investors, this reinforces the importance of diversification, a quality bias, and a disciplined approach as portfolios navigate a period of heightened uncertainty and shifting regime dynamics.
Source: Bloomberg as of March 31, 2026. S&P 500 = S&P 500 Total Return Index; Equal Weight S&P 500 = S&P 500 Equal Weighted USD Total Return Index; Financials = S&P 500 Financials Sector GICS Level 1 Index; Consumer Discretionary = S&P 500 Consumer Discretionary Sector GICS Level 1 Index; Information Technology = S&P 500 Information Technology Sector GICS Level 1 Index; Communication Services = S&P 500 Communication Services Sector GICS Level 1 Index; Healthcare = S&P 500 Healthcare Sector GICS Level 1 Index; Real Estate = S&P 500 Real Estate Sector GICS Level 1 Index; Industrials = S&P 500 Industrials Sector GICS Level 1 Index; Consumer Staples = S&P 500 Consumer Staples Sector GICS Level 1 Index; Utilities = S&P 500 Utilities Sector GICS Level 1 Index; Materials = S&P 500 Materials Sector GICS Level 1 Index; Energy = S&P 500 Energy Sector GICS Level 1 Index.
A new energy shock
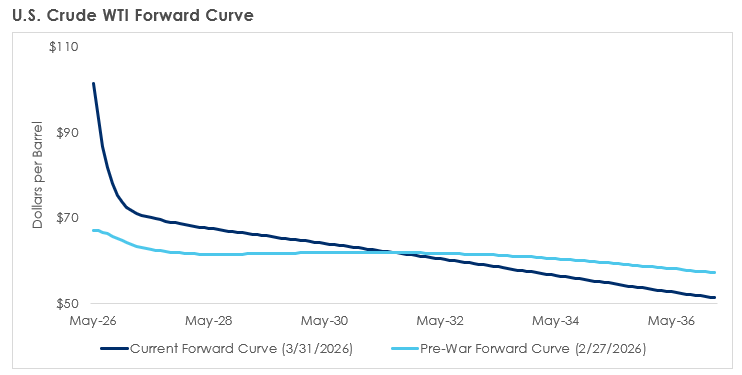
Coming into the first quarter, markets broadly expected that the U.S. would take some form of military action in Iran. The prevailing consensus, however, was that any operation would be limited in scope and duration, and, critically, would avoid meaningful disruption to global energy flows. That assumption proved wrong. Rather than a brief, contained episode, the conflict escalated in ways that directly impacted energy infrastructure and shipping, culminating in the effective closure of the Strait of Hormuz and forcing markets to rapidly reprice geopolitical risk. WTI crude prices rose 76.6 percent in the first quarter as diesel fuel and gas at the pump jumped 54.3 percent and 43.5 percent, respectively. The surge in energy prices prompted investors to recalibrate expectations around both inflation and growth, evaluating whether higher energy costs would persist and push inflation and interest rates higher, and how deeply the direct and indirect effects of the shock might slow economic activity.
Source: Bloomberg as of March 31, 2026.
Near-term oil price expectations shifted materially higher at the end of the first quarter. That said, farther out the curve, markets assume a normalization, with futures implying crude prices in the $70–$85 per barrel range in the second half of 2026 and into 2027, compared with roughly $100 per barrel at the end of the quarter. This repricing has pushed near term inflation expectations higher, as reflected in elevated one year inflation swaps and OECD estimates that U.S. inflation could temporarily approach 4 percent. Historically, however, the U.S. economy has demonstrated an ability to absorb oil prices at or near these levels. When the economy last experienced a truly recessionary oil shock during the Global Financial Crisis, household net worth was roughly one third of where it stands today. Moreover, UBS estimates that even with oil at $100 per barrel, energy spending would account for only about 2 percent of U.S. GDP, a level well below those historically associated with severe macro stress.
Consistent with this backdrop, growth and earnings expectations have remained relatively resilient. Consensus forecasts for 2026 U.S. real GDP growth have edged down modestly, by approximately 0.2 percentage points, to 2.3 percent, while expected S&P 500 earnings per share growth for 2026 remains healthy at roughly 16.5 percent. First quarter earnings and forward guidance will be critical in determining whether this outlook requires further revisions. However, should earnings and margins hold up reasonably well, that resilience would likely help stabilize and support equity markets as we move through 2026.
Source: Bloomberg as of March 31, 2026.
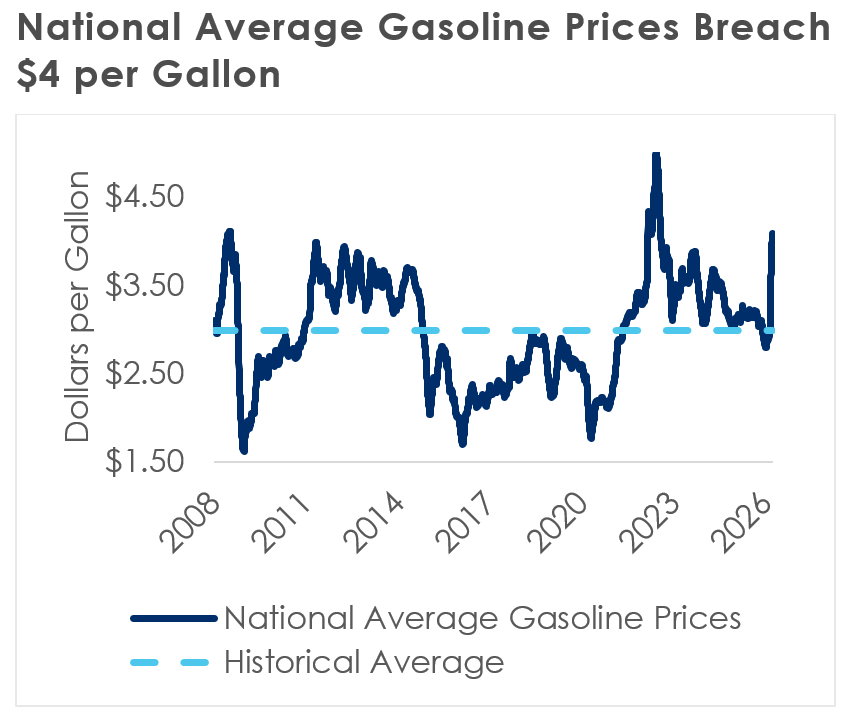
As we look into the second quarter and beyond, the macro backdrop is mixed but not decisively negative. Labor markets are softening, but remain far from collapsing, with job losses limited and employment adjusting more through reduced hiring than outright layoffs. The consumer continues to show resilience on average, supported by higher tax refunds and elevated household balance sheets, though that strength is now increasingly tested by higher energy prices at the pump. More concretely, based on average household gasoline consumption reported by the U.S. Energy Information Administration, a $1 per gallon increase implies roughly $1,000–$1,200 in additional annual fuel costs for the typical household.
However, according to the Wall Street Journal, while the recent jump in gasoline prices has been abrupt and highly visible, reversing a period in which consumers had benefited from sub‑$3 gasoline, prices remain well below prior peaks when viewed in real terms. Adjusted for inflation, pump prices are still lower than those experienced during the 2008 and 2022 energy shocks, suggesting that while the move may weigh on sentiment, it is unlikely on its own at current levels to meaningfully derail consumer spending or the broader economic expansion. At the same time, housing remains a clear weak spot, reflecting the cumulative effects of elevated mortgage rates and constrained affordability. Offsetting some of these headwinds, leading indicators in manufacturing have begun to improve, with PMIs stabilizing and edging higher, while capital expenditures—particularly related to AI, energy, and infrastructure—remain robust and continue to provide an important source of economic support.
Source: Bloomberg as of March 31, 2026.
Overall, the economy for now appears to be navigating a period of crosscurrents rather than a clear inflection toward recession. While higher oil prices, restrictive financial conditions, and a sluggish housing sector represent meaningful headwinds; improving activity indicators and sustained investment suggest the expansion retains underlying momentum. The balance between these forces will determine whether growth slows or proves more resilient than feared as the year progresses.
From cuts to hikes to cuts
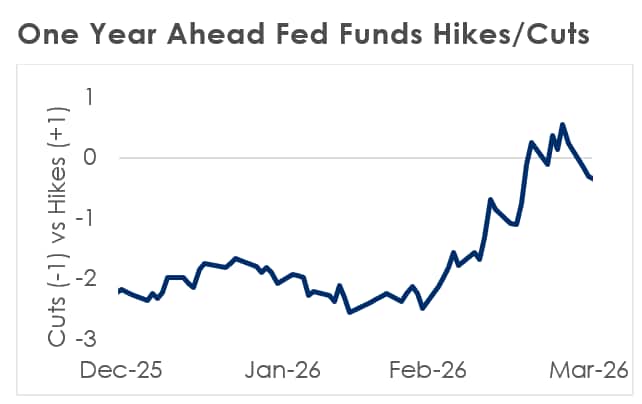
Bond investors entered the year expecting roughly two 25 basis point rate cuts, reflecting expectations that inflation would continue to ease and that a new Federal Reserve chair might tilt the Committee toward a more accommodative stance. While markets initially reacted favorably to the nomination of former Fed Governor Kevin Warsh, that optimism was short lived. The outbreak of war involving Iran quickly altered the macro backdrop, triggering a sharp rise in Treasury yields and forcing a reassessment of inflation risks.
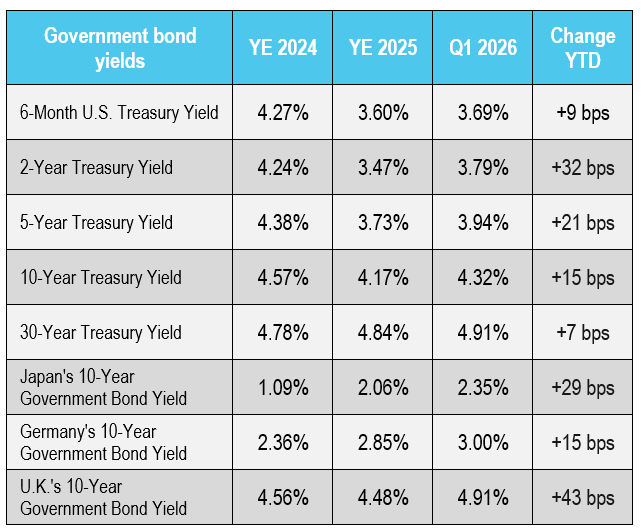
As anticipated, the Federal Reserve left policy unchanged at the March meeting and maintained one rate cut in its dot plot. However, the surge in oil prices and the growing likelihood that inflation would move firmly above 3 percent this year led bond markets, at one point, to price a non-trivial probability of an outright rate hike in 2026. While those expectations have since receded, short-term rate markets remain volatile and highly sensitive to headlines. Notably, despite early year expectations that the Treasury yield curve would steepen, the opposite has occurred, with the 2s–10s spread narrowing by approximately 18 basis points to 52 basis points over the course of the first quarter.
Source: Bloomberg as of March 31, 2026.
Historically, the Federal Reserve has tended to look through energy driven inflation shocks, viewing them as largely exogenous and transitory rather than indicative of overheating demand. In these episodes, policymakers have focused less on near term headline inflation and more on whether higher energy prices begin to feed into inflation expectations, wage growth, or core price pressures. When energy shocks coincide with a softening labor market, the Federal Reserve typically becomes even more cautious, as additional tightening risks amplifying downside growth dynamics.
Source: Bloomberg as of March 31, 2026.
Uncertainty around the ultimate economic pass through of higher energy prices, whether through weaker demand, margin compression, or organically tighter financial conditions, further complicates the case for preemptive action. An energy shock layered on top of emerging labor market fragility should bias policymakers toward patience rather than renewed tightening, even as inflation readings remain uncomfortably elevated.
Equity Markets: Two Mechanisms
Against this macro backdrop, equity performance has been driven primarily by two forces: Middle East-related risk premia and the accelerating AI buildout.
Geopolitical tensions have weighed on equities primarily through their impact on costs, confidence, and interest rate expectations. Rising energy prices and uncertainty related to the duration of the conflict have acted as a tax on consumers and businesses, pressuring sentiment and raising concerns around the durability of demand. At the same time, the reassessment of the expected path of interest rates has had a direct mechanical impact on equity valuations. As expectations for rate cuts have been pushed further into the future, discount rates have risen, reducing the present value of longer-dated cash flows and weighing disproportionately on growth-oriented equities.
Source: Bloomberg as of March 31, 2026.
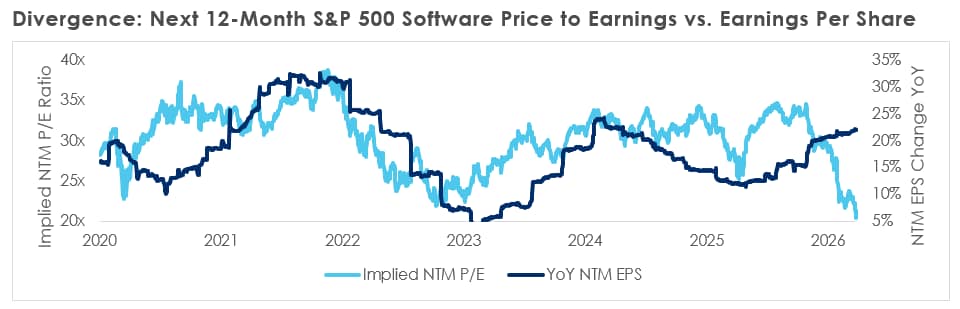
Offsetting these headwinds, the continued expansion of AI investment remains a powerful structural tailwind. The potential for productivity gains, efficiency improvements, and deflationary effects on supply generation represents a meaningful positive force for long‑term growth and margins. However, the AI buildout also introduces a two‑sided risk. Weak returns on the capital being deployed could result in poor investment outcomes, while successful AI adoption risks accelerating structural disruption across industries. In the current environment, markets appear increasingly focused on this latter risk, particularly within software and other tangible asset‑light business models where AI‑driven substitution is most immediate. This nuance is evident when comparing next 12‑month EPS to next 12‑month P/E ratios. Near‑term earnings expectations remain healthy, but valuations that incorporate obsolescence risk have declined materially.
Source: Bloomberg as of March 31, 2026.
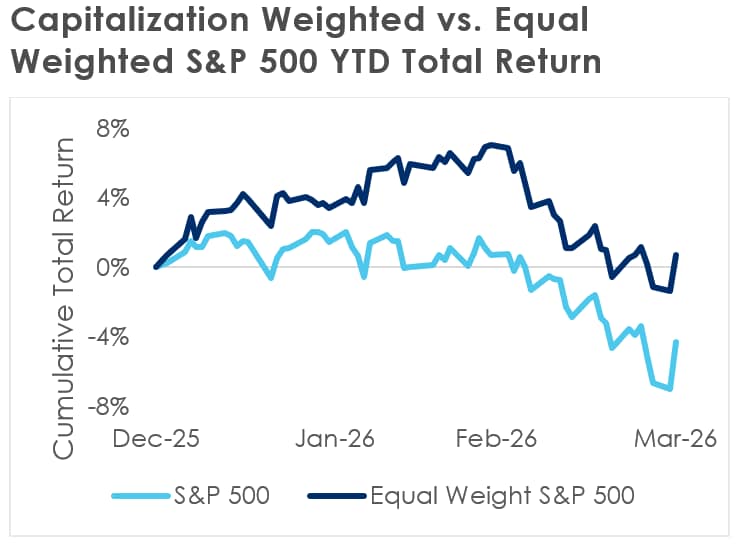
These forces have expressed themselves not through broad market weakness, but through widening dispersion and rotation beneath the surface. Areas of the market with greater sensitivity to discount rates and concentrated AI-replacement risk have underperformed, while sectors with tangible assets, pricing power, or direct exposure to energy, infrastructure, and industrial investment have proved more resilient. This dynamic is evident in the outperformance of the broader equal weighted S&P 500, which has returned 0.7 percent year to date, relative to the concentrated capitalization weighted index, which has returned -4.3 percent year to date due to its heavy concentration in large-cap technology.
Credit markets: Solvency vs. valuation risk
Credit markets have been influenced by many of the same macro forces, but the transmission mechanisms have differed notably from those affecting equities. One useful way to view this distinction is through a structural framework such as the Merton model, which treats corporate debt as a contingent claim on the firm’s underlying assets. In simple terms, bondholders sit above the equity layer and are therefore exposed primarily to downside tail risk: credit losses emerge when asset values fall far enough that the equity cushion is eroded and the firm’s liabilities are no longer fully covered, impairing solvency.
This framework helps explain why a higher expected path of interest rates has not had a proportional impact on credit markets relative to equities. While rising discount rates mechanically compress the present value of future cash flows and weigh heavily on equity valuations, credit performance is driven more directly by changes in default risk and recovery expectations. As long as companies maintain sufficient asset coverage and cash flow generation to service their obligations, higher interest rates alone do not necessarily undermine creditworthiness to the same extent they pressure equity prices.
Instead, credit markets have been more sensitive to risks that directly challenge the durability of asset values and business models. In the current environment, this has focused credit investor attention distinctly on obsolescence risk associated with rapid AI adoption, particularly in lower quality and software exposed segments where balance sheet flexibility is limited. At the same time, the risk of complete and immediate displacement may be overstated. Frictions such as customer switching costs, integration timelines, and organizational inertia tend to slow the pace of disruption, making transitions more gradual and uneven rather than abrupt. As a result, credit outcomes are likely to be driven less by binary disruption events and more by the cumulative erosion of margins, cash flows, and asset coverage over time, balanced with management responses through innovation and operational change.
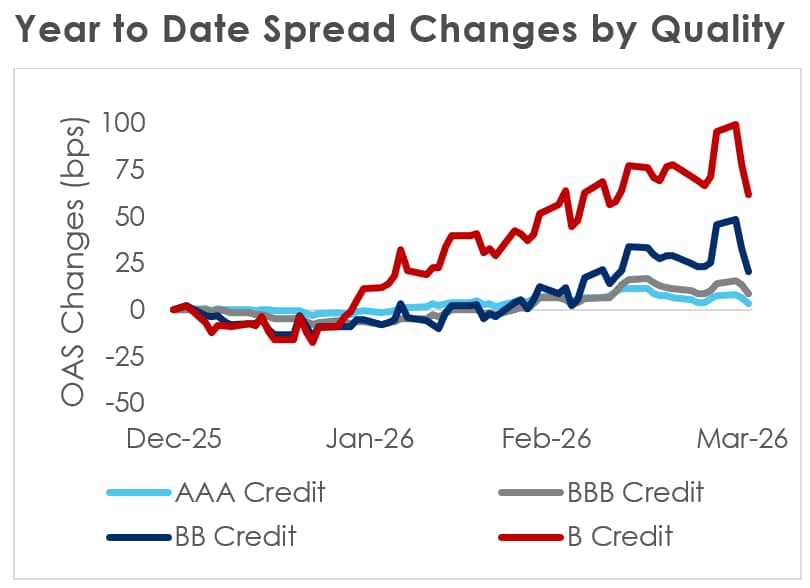
Source: Bloomberg as of March 31, 2026. OAS = option adjusted spread
As with equity markets, dispersion has become increasingly evident within credit markets, particularly across quality and sector dimensions. At an aggregate level, at the end of the quarter, investment grade corporate spreads remain historically tight at approximately 90 basis points, well below their longer-term average near 145 basis points, while high yield spreads at roughly 330 basis points also sit meaningfully inside their long term average of approximately 510 basis points. That said, more recent repricing is evident, with investment grade spreads widening nearly 20 basis points from their recent tights and high yield spreads roughly 80 basis points wider than their respective tights. Beneath the surface, dispersion is more pronounced, with software exposed investment grade Business Development Company credit spreads hovering roughly 30 basis points above historical averages, while the spread differential between A‑ and B‑rated credits has widened to nearly 270 basis points, approaching the widest levels seen over the past year. This environment reflects heightened perceived risk across these dimensions, while also creating opportunities for disciplined, bottom-up credit analysis.
Looking ahead
The first quarter reinforced that markets are no longer being driven primarily by abundant liquidity, but by a more discerning assessment of real growth, real rates, and real earnings power. The key question is whether the economy can absorb the energy shock and avoid a material deterioration in financial conditions or corporate fundamentals.
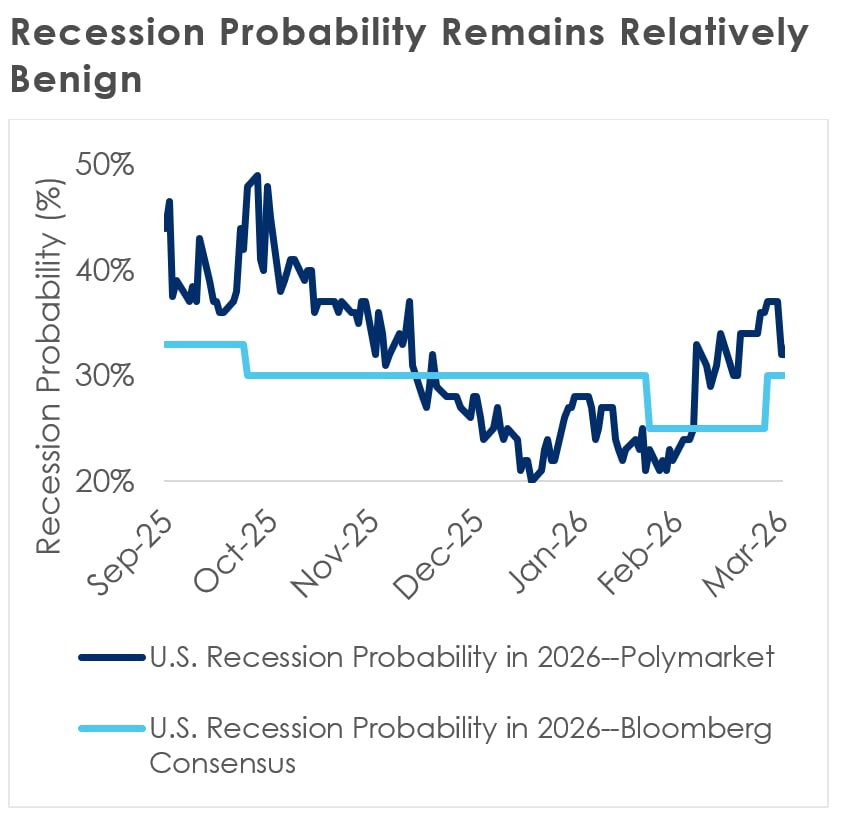
In that context, the near term is less about a clean directional call and more about the path of second order effects. Markets are already signaling that the shock is expected to normalize further out the curve, but the period in between may be defined by higher volatility as investors watch whether there are spillover impacts on labor markets, capital spending, earnings, and/or financial conditions. However, for now, outright recession risk appears contained.
The midterm elections add another layer of uncertainty, with affordability emerging as a key flashpoint. On Polymarket, Democrats are priced as clear favorites to win the House, with implied odds in the mid-80s to near 90 percent, while Senate control remains close to a coin flip. The distinction matters because the House can shape fiscal outcomes through funding leverage and oversight, while the Senate can constrain execution through confirmations and legislative control. The resulting policy uncertainty adds another source of volatility as markets weigh not just election outcomes, but their implications for fiscal direction and execution risk.
___________________________