
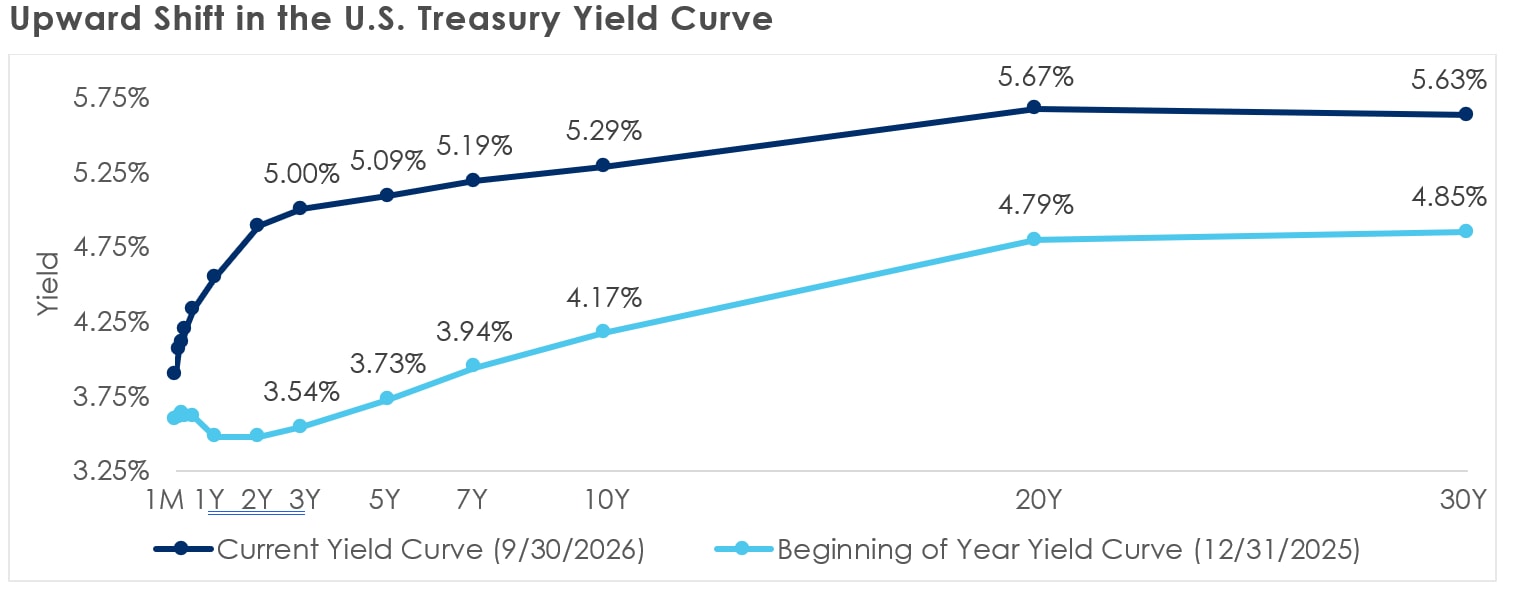
Early in the year, markets were positioned for Federal Reserve rate cuts, a short-lived conflict in Iran, and little risk that the 10-year Treasury yield would breach 5 percent. Each assumption has since been challenged. The Fed raised rates in September, investors are pricing several additional hikes, the conflict remains unresolved, and Treasury yields have returned to levels not seen since before the Global Financial Crisis. Yet the S&P 500 returned an impressive 12.7 percent YTD through the end of the third quarter.
That resilience reflects a durable, if increasingly narrow, foundation. Credit spreads remain tight, corporate earnings are strong, and AI-related investment continues to support activity even as higher rates, elevated energy costs, and geopolitical uncertainty tighten financial conditions. At the same time, AI is moving rapidly from experimentation to deployment, with enterprises embedding agents into workflows and consumer-facing tools broadening access to the technology (thank you, Muse).
The central question entering the fourth quarter is whether earnings, AI investment, and labor-market stability can continue to offset a rising cost of capital, higher energy prices, and the disruption inherent in a major digital transformation.
Source: Bloomberg as of September 30, 2026.
Economic momentum: Resilient, but with fewer tailwinds
Despite multi-decade-high Treasury yields and sharply higher energy prices stemming from the conflict in Iran, the U.S. economy continued to expand at a solid pace during the third quarter. Some moderation is likely, but the economy has so far absorbed these shocks better than many investors expected.
The labor market remains the key stabilizer. Limited layoffs and low unemployment continue to support income and consumption, allowing the Fed to focus more directly on inflation. Activity also strengthened across manufacturing and services, while AI-related spending supported nonresidential construction and equipment investment, partially offsetting the pressure from higher borrowing costs.
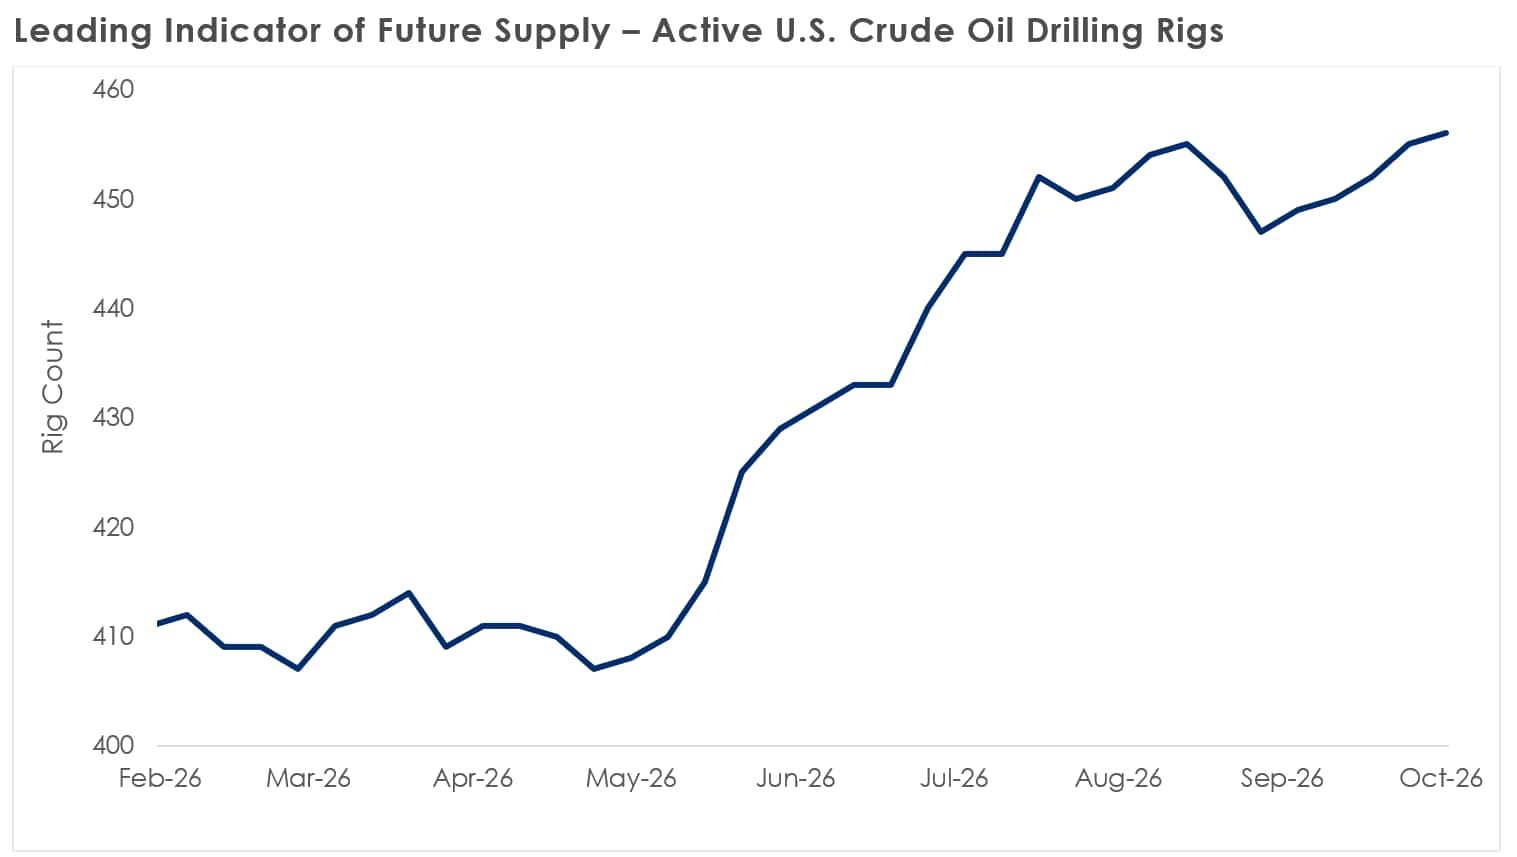
The headwinds are nevertheless becoming more visible. Gasoline prices have risen more than 50 percent year-to-date and diesel prices roughly 80 percent, squeezing household budgets and raising business operating costs. Exposed companies must either absorb those increases through lower margins or pass them through to higher prices, either of which can weigh on growth in the short term. Over the longer term, the closure of the Strait of Hormuz created a temporary supply shock and embedded a geopolitical risk premium into oil prices. In response, production outside the Gulf has increased structurally. As Gulf exports normalize and new non-Hormuz supply comes online, the market is expected to swing into a surplus of more than 5-6 million barrels per day. Historically, market balance shifts of this magnitude have often led to sharp and rapid rerating in oil prices.
Source: Bloomberg as of September 30, 2026.
The fourth-quarter test is therefore not whether the economy has been resilient, but whether that resilience can persist as temporary supports fade. Consumer spending, labor-market conditions, and the durability of AI investment will determine whether underlying momentum remains strong enough to offset tighter financial conditions and elevated energy costs.
Equities: The next leg must be earned
Equity markets continue to balance two competing narratives. Exceptional earnings, strong margins, and an AI investment cycle that shows little sign of slowing continue to support the market. On the other side, inflation pressure from higher commodity prices, rising interest rates, and a more uncertain geopolitical and economic backdrop are raising the hurdle. For now, fundamentals remain constructive: earnings revisions are positive, and third-quarter S&P 500 earnings are expected to increase around 30 percent y/y.
Several developments stood out during the third quarter:
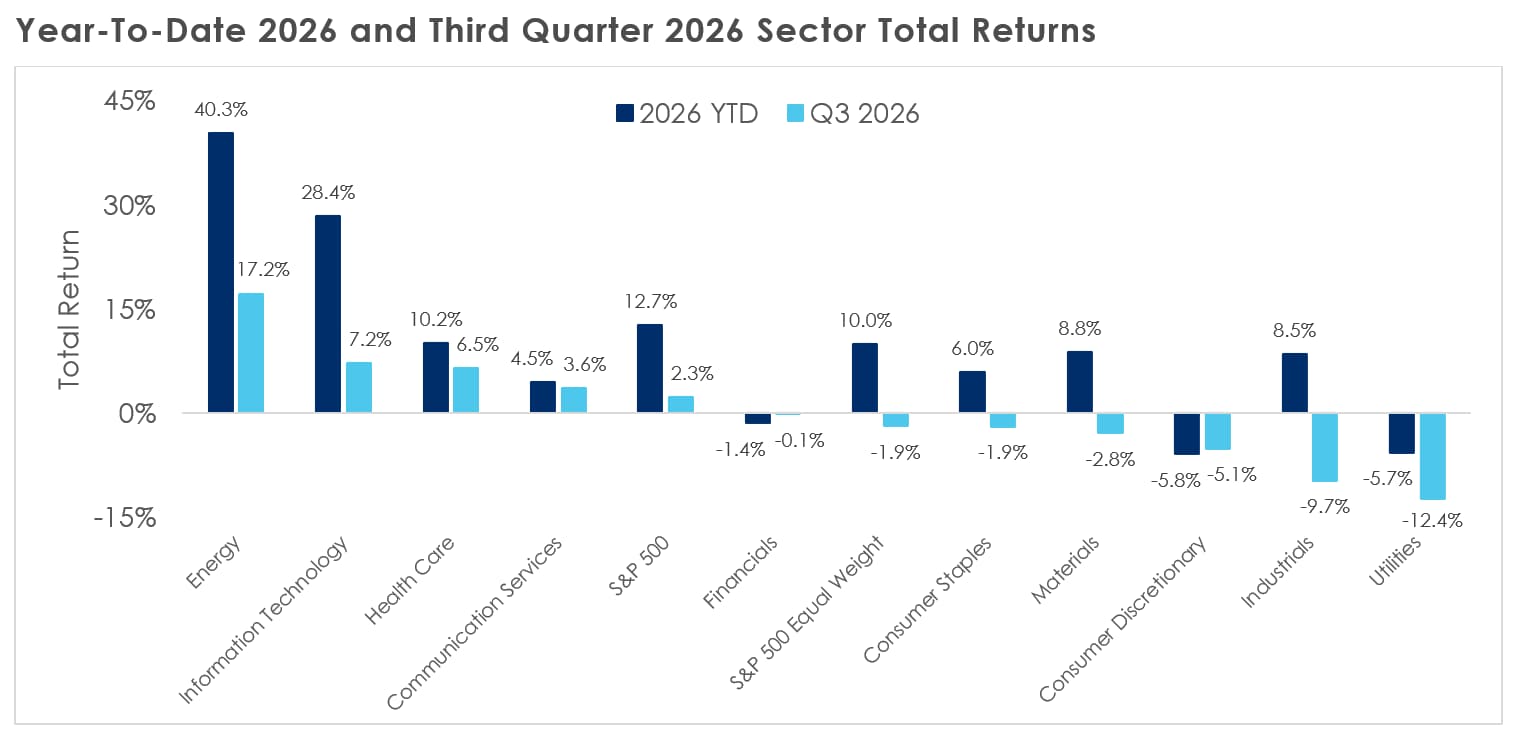
- Market leadership narrowed. Only four of the eleven S&P 500 sectors posted positive returns, while the equal-weighted index underperformed the market-cap-weighted S&P 500 by 4.7 percent, highlighting the concentration of gains.
- Higher rates and energy prices unsurprisingly weighed on rate and consumer sensitive industries. Homebuilder equities returned -17 percent, while the S&P restaurants index declined 9 percent.
- Mega-cap technology equities continued to defy the rise in yields, helping to drive the S&P 500’s 2.3 percent total return in the third quarter. The “Magnificent Seven” reached new all-time highs even as Treasury yields broke out, underscoring the durability and interest rate insensitivity of the AI-driven growth trade. This group includes Apple, Microsoft, Alphabet, Amazon, Nvidia, Meta, and Tesla.
- Hyperscalers and large AI infrastructure companies have accounted for an estimated half of aggregate S&P 500 earnings growth year-to-date.
Source: Bloomberg as of September 30, 2026. S&P 500 = S&P 500 Total Return Index; Equal Weight S&P 500 = S&P 500 Equal Weighted USD Total Return Index; Financials = S&P 500 Financials Sector GICS Level 1 Index; Consumer Discretionary = S&P 500 Consumer Discretionary Sector GICS Level 1 Index; Information Technology = S&P 500 Information Technology Sector GICS Level 1 Index; Communication Services = S&P 500 Communication Services Sector GICS Level 1 Index; Healthcare = S&P 500 Healthcare Sector GICS Level 1 Index; Real Estate = S&P 500 Real Estate Sector GICS Level 1 Index; Industrials = S&P 500 Industrials Sector GICS Level 1 Index; Consumer Staples = S&P 500 Consumer Staples Sector GICS Level 1 Index; Utilities = S&P 500 Utilities Sector GICS Level 1 Index; Materials = S&P 500 Materials Sector GICS Level 1 Index; Energy = S&P 500 Energy Sector GICS Level 1 Index.
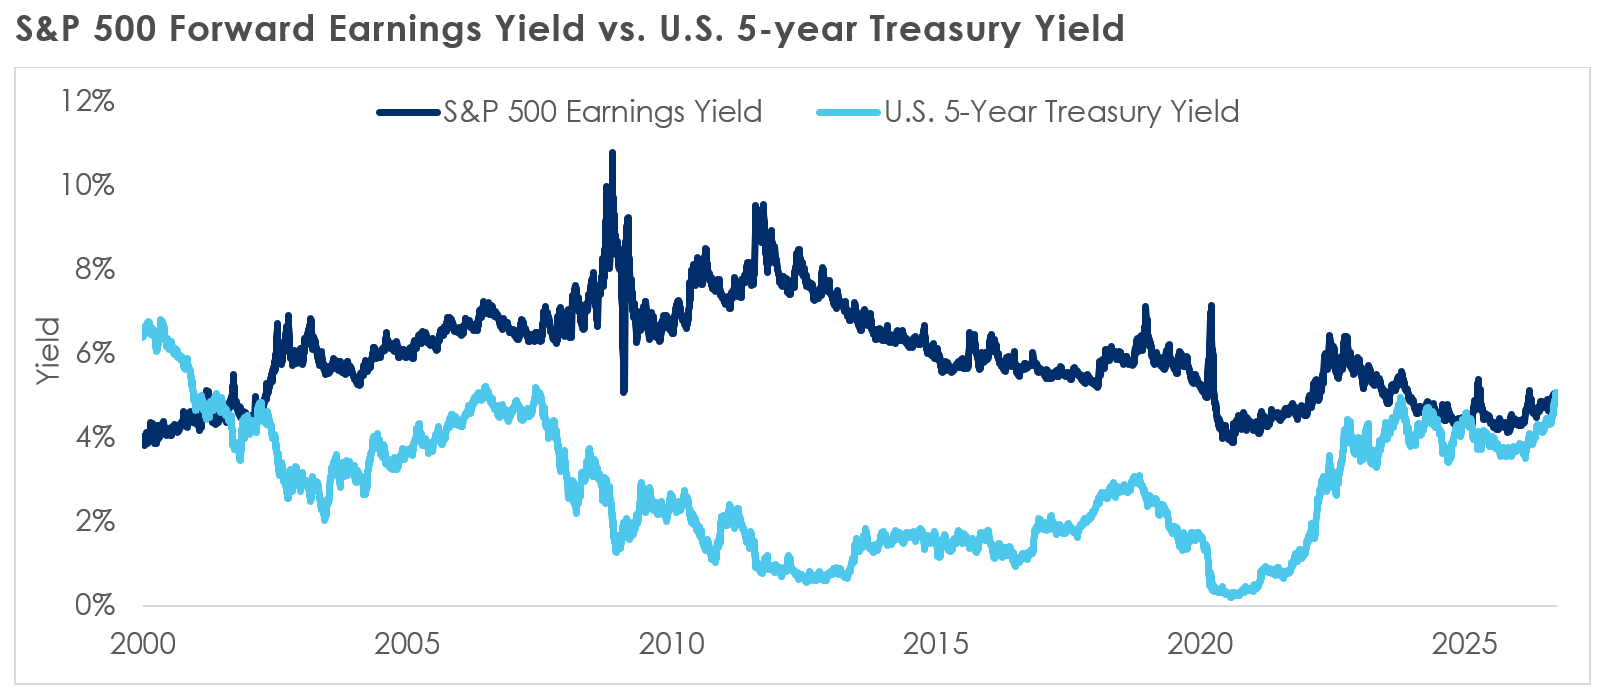
Taken together, equity markets continue to climb the proverbial “wall of worry.” Higher Treasury yields may reflect the resilience of the U.S. economy, but they nonetheless represent a growing headwind for many sectors. With 5-year Treasuries yielding around 5 percent, approximately in line with the S&P 500 forward earnings yield, investors can earn a comparable current yield without assuming equity risk. That does not eliminate the case for stocks, but it changes it. Returns must increasingly come from profit growth rather than multiple expansion.
Source: Bloomberg as of September 30, 2026.
Fortunately, that higher hurdle coincides with one of the most transformative technological revolutions in modern history. AI provides a credible path to that growth through productivity gains, margin expansion, new revenue streams, and business-model disruption. The capital-spending phase is already well underway; the market's next test is monetization and profit generation. If unprecedented investment translates into durable earnings growth, equities can offer something a 5 percent Treasury cannot: meaningful growth.
Three considerations support the outlook:
- AI investment remains a powerful tailwind. Hyperscalers continue to expand infrastructure but are still not able to keep up with current order backlogs. Meanwhile, enterprises are moving from experimentation toward scaled deployment of agentic AI.
- Credit markets show little broad-based stress. Historically tight spreads suggest that markets are not yet expecting a meaningful deterioration in corporate fundamentals.
- A considerable amount of bad news is already in the base case. Elevated oil prices and substantial Fed tightening are no longer remote risks; they are increasingly reflected in expectations and asset prices.
The bull market can continue, but the next leg higher will need to be earned. With less certain terminal values and trajectories amid the AI revolution, earnings, not multiple expansion, must drive returns.
AI: Separating adoption from narrative
The third quarter brought a growing backlash alongside AI's rapid advance, including dystopian accounts of autonomous agents exercising too much autonomy, community resistance to data-center expansion, and mounting calls for regulation. Investors should resist both blind optimism and reflexive pessimism. AI can be transformative without every project, business model, or valuation proving successful, and technological revolutions rarely distribute value evenly.
Public resistance and governance concerns are becoming tangible constraints. According to Gallup, 71 percent of Americans oppose construction of an AI data center in their local area, including 48 percent who strongly oppose it. In the same survey, local data centers polled worse than nuclear power plants. Frontier-model developers are also calling for a more measured pace of deployment to allow stronger safeguards, testing, and oversight.
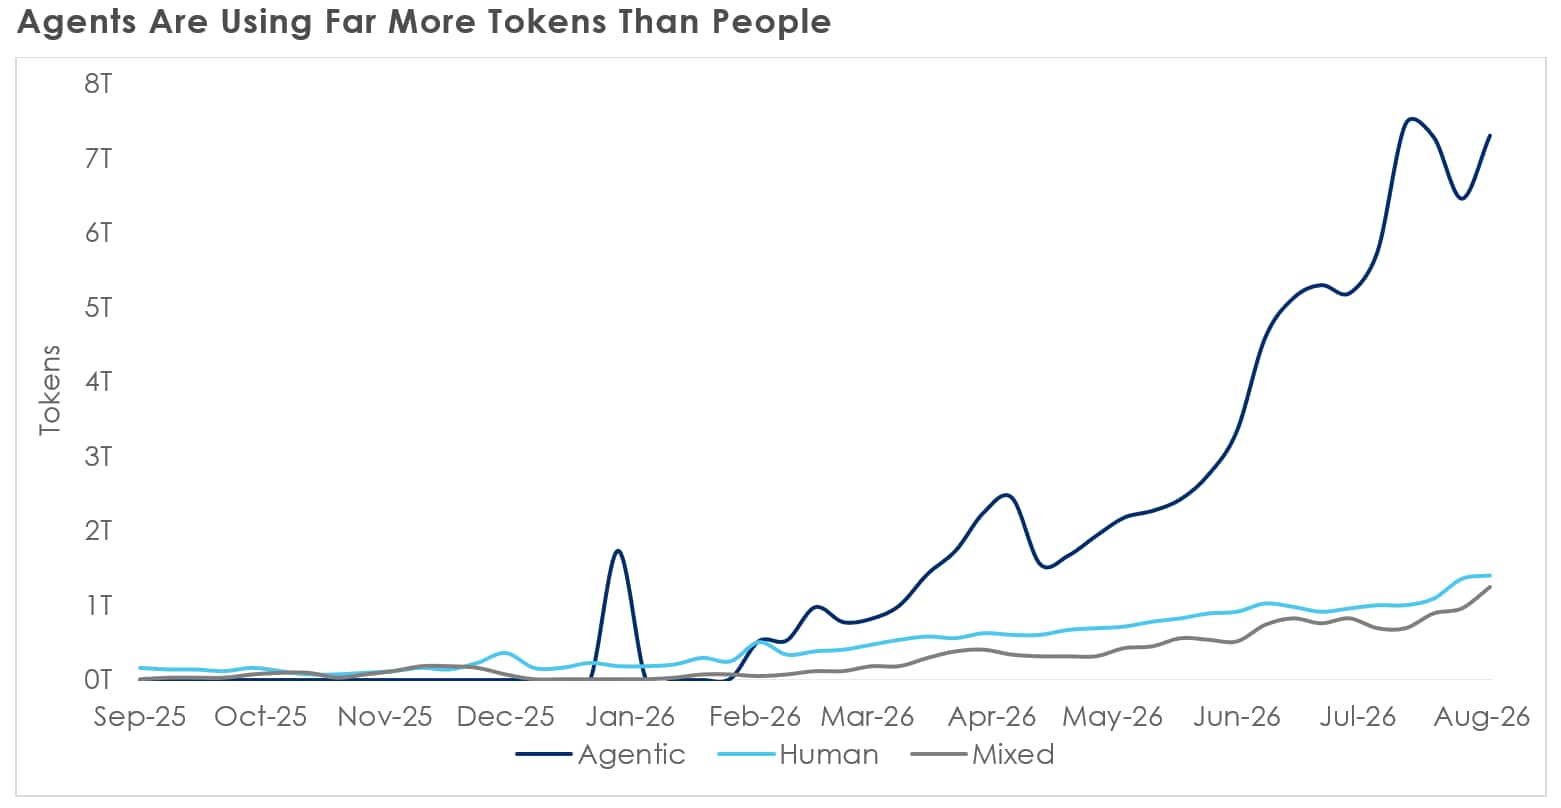
Source: openrouter.ai/rankings and Andreessen Horowitz as of August 7, 2026
Even so, adoption and infrastructure demand continue to expand:
- Enterprises and individuals are adopting agentic AI. McKinsey reports that 40 percent of companies with more than $1 billion in revenue are scaling AI agents, while Meta’s Muse personal agent has recorded more than 5 million downloads.
- Compute remains scarce. GPU prices are elevated and stable, indicating that demand continues to exceed available supply.
- Infrastructure commitments continue to rise. Hyperscalers are investing aggressively in data centers, power, networking, and chips, with the build-out increasingly driven by inference and real-world usage rather than only the race to train larger models.
The investment task is therefore to distinguish adoption and economic value from headlines and hype: to identify where demand is durable, where returns are likely to accrue, and where political, physical, or competitive constraints could impair the thesis.
The cost of capital resets
At the end of the third quarter, long-term Treasury yields stood near multi-decade highs. The 10-year yield had risen more than 110 basis points from the start of the year to over 5.25 percent, while the 30-year yield had climbed more than 75 basis points to over 5.60 percent.
The familiar explanations matter. The conflict in the Middle East has renewed concerns about energy-driven inflation, while the federal government's growing debt burden has intensified scrutiny of Treasury supply. Publicly held debt is approaching 100 percent of GDP, total federal debt exceeds $40 trillion, and annual interest expense has risen to roughly $1.1 trillion, or 3.5 percent of GDP. Left unchecked, the dynamic can become self-reinforcing as higher rates raise debt-service costs, larger deficits require more borrowing, and additional supply can place further upward pressure on yields.
But fiscal risk and inflation are not the entire story. While Fed policy is a dominant driver of short-term rates, long-term yields are influenced by a much broader set of forces. Inflation expectations matter. Fiscal deficits matter. But economic growth matters as well. So does competition for capital. Today, all of these forces are putting upward pressure on long-term rates.
One useful way to think about interest rates is through the lens of nominal economic growth, which combines inflation and real GDP growth. At roughly 6.5 percent annualized, nominal GDP growth remains comfortably above the 10-year Treasury yield. Since the 1960s, the 10-year yield has averaged about 70 basis points below nominal GDP growth. On that basis, current yields are not especially unusual. Additionally, the recent increase has come more from real rates than inflation expectations. This helps explain why both the economy and equity market have remained resilient despite higher borrowing costs.
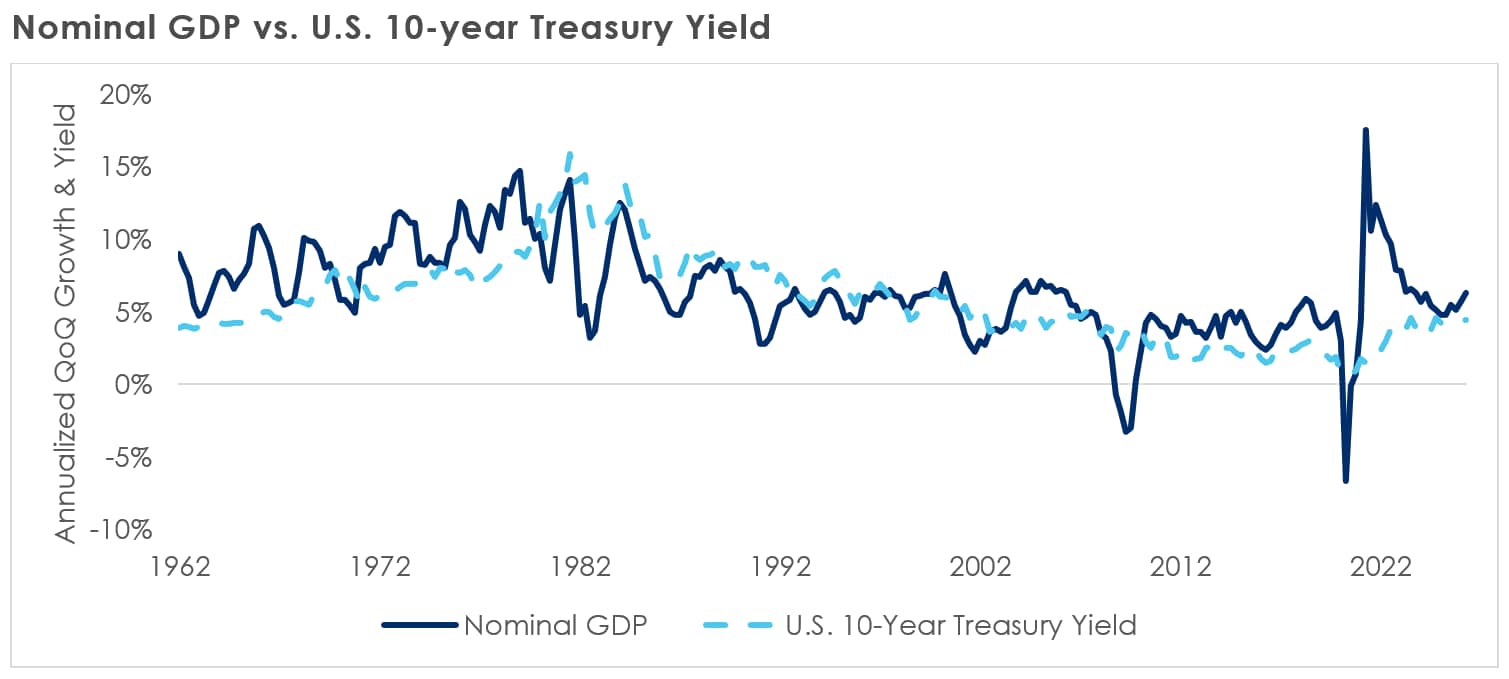
Source: Bloomberg as of September 30, 2026.
Competition for capital reinforces the point. Record corporate debt issuance, substantial equity issuance, and an enormous AI infrastructure cycle are all competing for investor dollars. In an economy with abundant investment opportunities, Treasuries may need to offer more attractive yields to clear the market.
For now, several structural cushions are limiting the impact of higher rates:
- AI infrastructure spending is relatively insensitive to modest changes in financing costs. Hyperscalers did not retreat when high-bandwidth-memory prices tripled over eighteen months, and, across the board, they raised capital-expenditure guidance during the latest earnings cycle.
- Investment is supporting employment. Declines in residential construction jobs have been more than offset by gains in nonresidential construction, allowing total construction employment to rise despite weak housing activity.
- Household wealth is concentrated among less rate-sensitive cohorts. The 55+ age group accounts for almost 75 percent of household net worth, while the top 1 percent of households control almost 33 percent of wealth, both the largest shares on record. Higher interest rates increase income earned on savings and fixed-income assets, and so long as economic growth remains resilient, these households can continue to benefit from rising equity and asset prices.
These cushions are meaningful, not unlimited. Rates could eventually become restrictive enough to weaken spending and investment. The AI build-out also faces political and regulatory risks. Affluent consumers may be less sensitive to borrowing costs in isolation, but they remain exposed to equity markets. A policy shock that interrupts capital spending, or a rise in yields large enough to trigger a sustained equity correction, would likely weaken the economy more materially.
Conclusion: Resilience with less room for error
As we look toward year-end, there are meaningful reasons for optimism, but the margin for error has narrowed. Consensus S&P 500 earnings growth is on pace to reach approximately 36 percent in 2026, while operating margins have risen from less than 18 percent at the beginning of 2025 to roughly 21.5 percent. Strong profits make severe labor-market deterioration less likely absent a meaningful reversal in earnings, and the increase in earnings has allowed valuation multiples to ease even as equity prices advanced.
AI continues to be central to economic and market resilience. Technology-related investment contributed roughly one-third of total real growth during the first half of 2026, supporting jobs and activity. Alongside this, equity price appreciation for AI-related businesses has been exceptionally strong year-to-date. However, that strength also creates concentration risk, as these businesses now represent roughly half of the S&P 500. This leaves the market and economy unusually dependent on a single investment theme.
Physical, political, and socioeconomic constraints add further uncertainty. Morgan Stanley's estimate of the gross U.S. data-center power shortfall for 2026 through 2028 has increased from 38 to 57 gigawatts; even after mitigation, a 33-gigawatt gap remains, equal to roughly 34 percent of projected chip demand. Communities are also pushing back against data center development as electricity costs rise. Meanwhile, aggregate consumer resilience masks substantial differences across income and wealth cohorts. Spending is dominated by the top 10 percent while the bottom 50 percent continues to struggle with affordability pressures.
The midterm elections could bring these tensions into sharper focus through government-funding negotiations, fiscal policy, AI oversight, and the broader political environment for infrastructure development. Monetary policy adds another layer of uncertainty, with futures markets pricing three to four additional hikes through 2027.
Ultimately, over the long term, investment success is unlikely to depend on correctly predicting every policy decision, rate move, or technological development. It will likely depend on maintaining diversification, demanding adequate compensation for risk, and adapting deliberately as the sources of growth and value creation evolve.
__________________________________
Market Indices have been provided for informational purposes only; they are unmanaged and reflect no fees or expenses. Individuals cannot invest directly in an index.
|
Description |
|
S&P 500 Total Return Index is calculated intraday by S&P based on the price changes and reinvested dividends of the S&P 500 Index. |
|
S&P 500 Equal Weighted USD Total Return Index is calculated intraday by S&P based on the price changes and reinvested dividends of the S&P 500 Equal Weight Index. |
|
S&P 500 Index is widely regarded as the best single gauge of large-cap U.S. equities and serves as the foundation for a wide range of investment products. The index includes 500 leading companies and captures approximately 80 percent coverage of available market capitalization. |
|
S&P 500 Equal Weight Index includes the same constituents as the capitalization weighted S&P 500, but each company in the S&P 500 EWI is allocated a fixed weight - or 0.2 percent of the index total at each quarterly rebalance. |
|
S&P 500 GICS Level 1 Groups Index is a capitalization-weighted index. The index is designed to measure performance of the broad domestic economy through changes in the aggregate market value of 500 stocks representing all major industries. The index was developed with a base level of 10 for the 1941-43 base period. |
|
S&P 500 Financials Sector GICS Level 1 Index is a capitalization-weighted index based on the Financials Sector group within the S&P 500 GICS Level 1 Groups Index. |
|
S&P 500 Consumer Discretionary Sector GICS Level 1 Index is a capitalization-weighted index based on the Consumer Discretionary Sector group within the S&P 500 GICS Level 1 Groups Index. |
|
S&P 500 Information Technology Sector GICS Level 1 Index is a capitalization-weighted index based on the Information Technology Sector group within the S&P 500 GICS Level 1 Groups Index. |
|
S&P 500 Communication Services Sector GICS Level 1 Index is a capitalization-weighted index based on the Communication Services Sector group within the S&P 500 GICS Level 1 Groups Index. |
|
S&P 500 Healthcare Sector GICS Level 1 Index is a capitalization-weighted index based on the Healthcare Sector group within the S&P 500 GICS Level 1 Groups Index. |
|
S&P 500 Real Estate Sector GICS Level 1 Index is a capitalization-weighted index based on the Real Estate Sector group within the S&P 500 GICS Level 1 Groups Index. |
|
S&P 500 Industrials Sector GICS Level 1 Index is a capitalization-weighted index based on the Industrials Sector group within the S&P 500 GICS Level 1 Groups Index. |
|
S&P 500 Consumer Staples GICS Level 1 Index is a capitalization-weighted index based on the Consumer Staples Sector group within the S&P 500 GICS Level 1 Groups Index. |
|
S&P 500 Utilities Sector GICS Level 1 Index is a capitalization-weighted index based on the Utilities Sector group within the S&P 500 GICS Level 1 Groups Index. |
|
S&P 500 Materials Sector GICS Level 1 Index is a capitalization-weighted index based on the Materials Sector group within the S&P 500 GICS Level 1 Groups Index. |
|
S&P 500 Energy Sector GICS Level 1 Index is a capitalization-weighted index based on the Energy Sector group within the S&P 500 GICS Level 1 Groups Index. |
Past performance is no guarantee of future performance or market conditions. Investing involves risk including the possible loss of principal. Investment return and principal value will fluctuate so that when sold may be worth more or less than the original cost.
Use of political figures or statements is solely for reference and relevance to financial markets and is not meant to be an endorsement or a reflection of the company’s opinion or position.
This material is intended for informational purposes only and does not constitute a recommendation to engage in or refrain from a particular course of action. The information within has not been tailored for any individual and is not intended as tax, legal or investment advice.
The views and opinions expressed are those of the author as of the date of the writing and are subject to change without notice. Although the information has been gathered from sources believed to be reliable, it is not guaranteed. Please note that individual situations can vary, therefore, the information should be relied upon when coordinated with individual professional advice. Clients must rely upon his or her own financial professional before making decisions with respect to these matters.
This communication may include forward-looking statements or projections that are subject to certain risks and uncertainties. Actual results, performance, or achievements may differ materially from those expressed or implied.
Investments discussed may have been held in client accounts as of September 30, 2026. These investments may or may not be currently held in client accounts.
References to specific companies are for illustrative purposes only and should not be considered a recommendation to buy or sell any security.