
Over the past two weeks Ukrainians have had their lives completely and disastrously disrupted. More than 3 million have now fled Ukraine to countries to the West, and more than 600,000 Ukrainians have become refugees within their own country, doing everything they can to avoid the escalating bombardment and destruction.
In just over two weeks, more than 1,300 Ukrainian and 5,000 Russian soldiers have been killed, while the count of Ukrainian civilian deaths continues to climb. Recent estimates are somewhere between 14,000 and 16,000 Ukrainians senselessly killed, with many more injured. As a comparison, it is worth noting there were fewer than 2,000 American troops killed during the entire 20-year war in Afghanistan.1
For Russian President Vladimir Putin, the invasion has gone much worse than expected, and he has now fired as many as eight generals for their incompetence. Progress in northern Ukraine has slowed for the Russians, and Ukrainian President Volodymyr Zelenskyy has been remarkable at galvanizing Ukrainian citizens.
Meanwhile Western nations have moved astonishingly quickly to enact sanctions including freezing more than $600 billion of Russian Central Bank assets, removing the majority of Russian banks from the global banking system, and either entirely restricting or greatly diminishing the ability for Russians to export their main product: oil — all of which has brought the Russian economy to its knees and will almost certainly result in a Russian default to foreign bond holders in the weeks to come.
In short, it has been chaos, terror, and murder, and for what seems to be no more of a reason than arrogance and historical delusion.
We must observe what horror is taking place in the world while also managing our own lives, and as a useful input, our own investments.
As such, let us take stock first of how markets have performed and, second, how to think of market performance during historic conflicts of this sort.
Market performance thus far
Let us first establish a reality: the United States, thus far, has been a safe haven market. Investors and real asset owners around the world have sold local investments and have purchased U.S. bonds, U.S. equities, and generally U.S. assets. This has counterbalanced the selling that has taken place by hedge funds and individuals, as examples, looking to reduce risk.
Among others, this is one of the benefits of being the world’s reserve currency and has certainly proven true in the last several weeks.
As such, despite how it may feel, markets have been fairly muted since Russia’s invasion of Ukraine began on the morning of Feb. 24.
Chart 1 is our own measurement of how much volatility has existed in the marketplace. While I won’t bore you with how it is calculated, it is essentially an estimate of how many “zigs and zags” occurred over recent days. We can make that calculation over many days of history, which then gives us a better sense of how much markets are moving around.
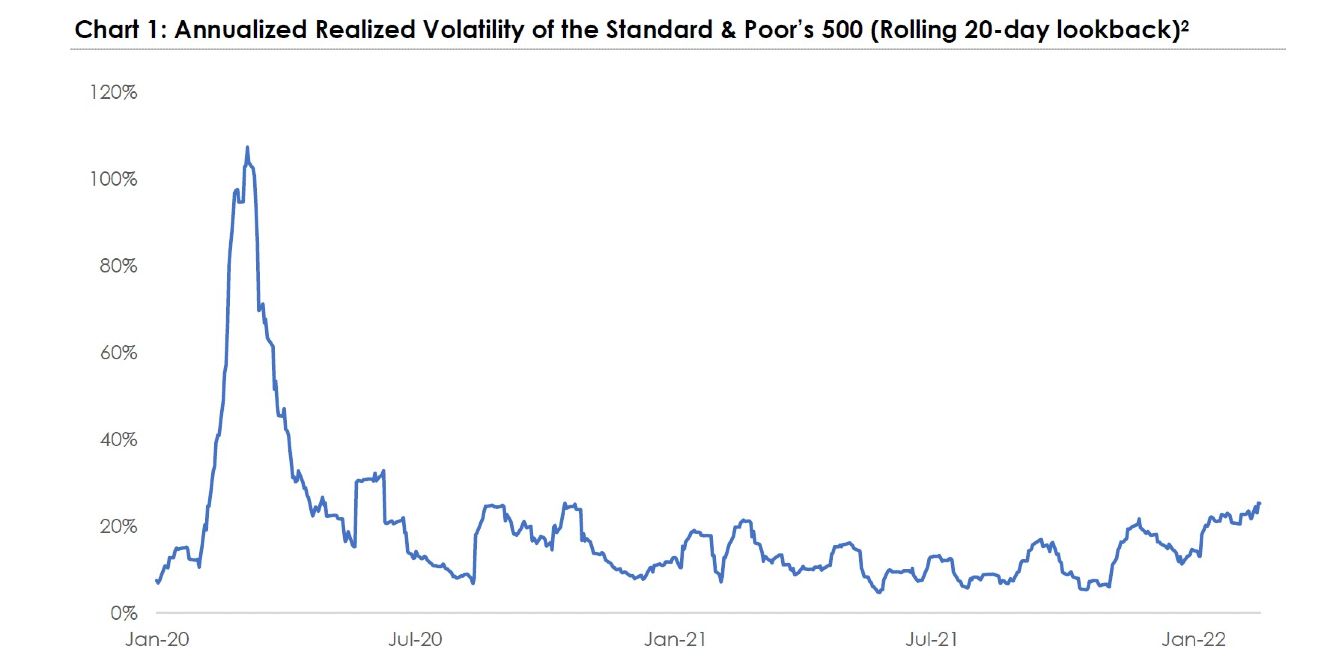
In short, at least within U.S. markets, volatility has increased, but not markedly. Said another way, the magnitiude of movements on a daily basis is higher, but not that much higher, and certainly nowhere near where we were during the COVID-19 selloff of 2020.
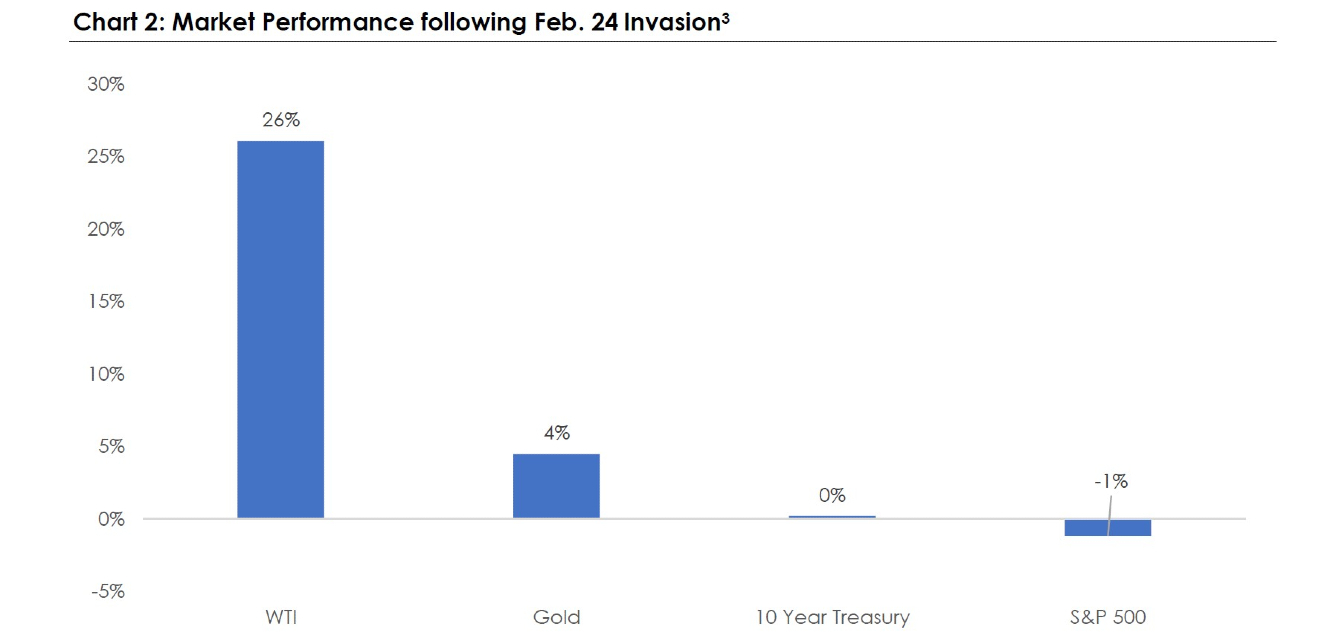
Which begs the question, how have markets actually performed? Chart 2 helps answer that question.
Past performance is not indicative of future results.
Starting from left to right, WTI (also known as West Texas Intermediate Oil) is up 26 percent since the invasion began. This is in line with our expectations (I predicted 20-30 percent in a previous market update) and consistent with shutting off a major supplier to world energy markets. (Note: Russia supplies roughly 8 percent of U.S. energy and roughly 40 percent of European energy.)4
Gold is up 4 percent or so, indicative of:
- A flight to quality and safe assets
- The increased inflation pressure both from Russia and non-Russia events taking place right now.
Also unsurprisingly, the U.S. 10-year Treasury note is up a bit as global investors have fled into U.S. assets, and the U.S. government is a highly credible borrower.
Perhaps most interestingly, U.S. equity markets are basically flat (down a little less than 1 percent).
Fear is up, uncertainty is up, and yet U.S. equity markets are roughly flat? How can this be?
While attribution over the short term is nearly impossible, here are couple of thoughts:
- As mentioned earlier, the U.S. has been a safe haven during this conflict. This is because we are: a) the world’s reserve currency, b) geographically distant from the conflict, and c) at least thus far, signaling we are unlikely to get involved militaristically.
- Incentives drive behavior and, for most companies, those incentives haven’t changed. We, as investors, provide our hard-earned capital to companies (either in the form of buying a portion of a company through stock or through lending to those companies through debt), and in exchange, the companies provide us some sort of return (either through dividends, bond payments, or earnings).
While No. 1 is more of a short-term dynamic, No. 2 is the primary long-term dynamic we are relying on over and over through market turbulence, volatility, pandemics, and other similar (or dissimilar) events and disruptions.
Historical perspective
Therefore, we might ask, how do markets perform historically during conflicts, and what should we expect if this escalates further, or goes on for much longer?
The short answer is we have no idea how this will play out. The strategy involved for all parties is complicated, nuanced, and mostly unpredictable (although we do believe we understand each country’s incentives). While we can speculate on outcomes given our historical biases and lenses, it is purely that, just speculation.
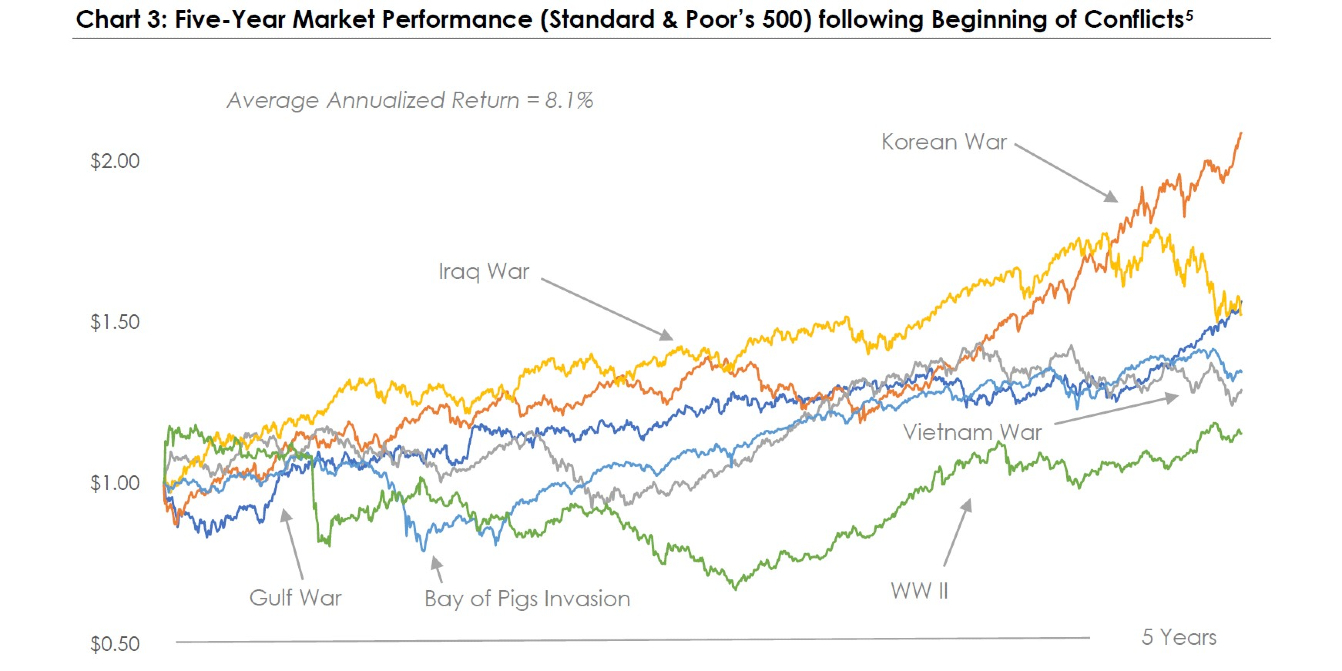
Yet if we rely on history to inform that question, then perhaps we can find some perspective. Which brings us to Chart 3.
Past performance is not indicative of future results.
While each military conflict was different, and each had its own storyline, conflict, decisions, and tragedy, by and large, markets were okay. The average annualized return of markets during these conflicts (for the five years following the beginning of the conflict) was 8.1 percent.
Could this time be different? Of course. Will it? We have no idea.
The point here is because we can’t predict the future, and certainly can’t predict this outcome, we must rely on the mere fact that incentives drive behavior. And over the long run, that principle has been remarkably reliable.
Lastly, I will wrap up with one final chart to help set expectations.
Past performance is not indicative of future results.
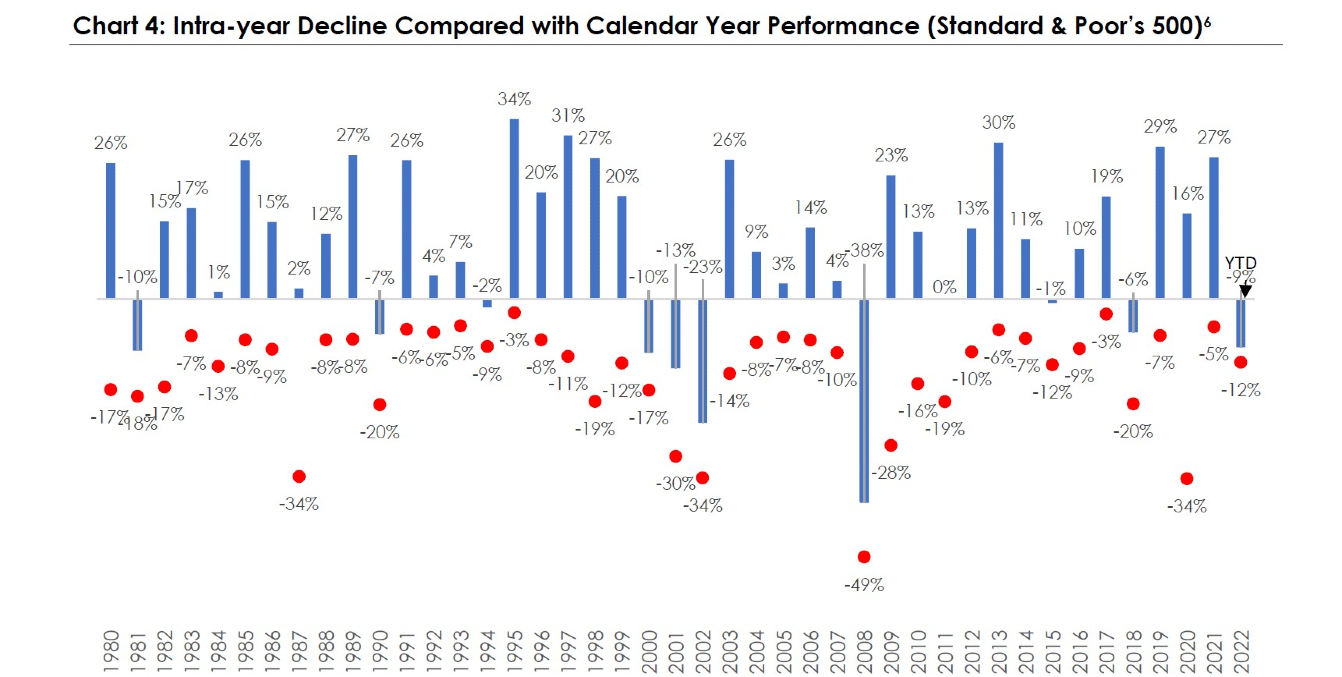
We went back 42 years and simply calculated two numbers: First, the peak-to-trough loss in the Standard & Poor’s 500 index during each year, and second, the full-calendar-year return for each year.
The red dots reflect the former, and the blue bars reflect the latter.
I love this chart because it teaches me two things:
1) Every single year has a sell-off. That is just the nature of markets and, I would argue, a healthy dynamic.
2) On average, if one ignores the ups and downs, markets returned more than 10 percent, on average over this time period.
Try to take the short term in stride (as hard as that can sometimes be) and turn your focus to the long term.
In closing, please know our thoughts are with the Ukrainian citizens in solidarity and in quiet prayer for a timely resolution.
Discover more from MassMutual …
When markets dive, keep your strategic calm
5 ways to prepare for an economic downturn
____________________________________
1 Source: https://www.defense.gov/casualty.pdf
2 Source: Bloomberg, and MassMutual Research as of March 11, 2022
3 Source: Bloomberg, and MassMutual Research as of March 11, 2022
4 Source: The US Energy Information Administration; https://www.eia.gov/dnav/pet/hist/LeafHandler.ashx?n=PET&s=MTTIM_NUS-NRS_1&f=M
5 Source: Bloomberg, and MassMutual Research as of March 11, 2022
6 Source: Bloomberg, and MassMutual Research as of March 11, 2022