.jpg?h=920&iar=0&w=2280)
At the beginning of 2024, economists largely agreed on a few key predictions: a noticeably slower pace of real GDP growth, sharply declining inflation as restrictive monetary policy took effect, a roughly 50 percent probability of a recession, and the onset of a relatively rapid interest rate-cutting cycle due to mounting economic pressures and/or declining inflation.
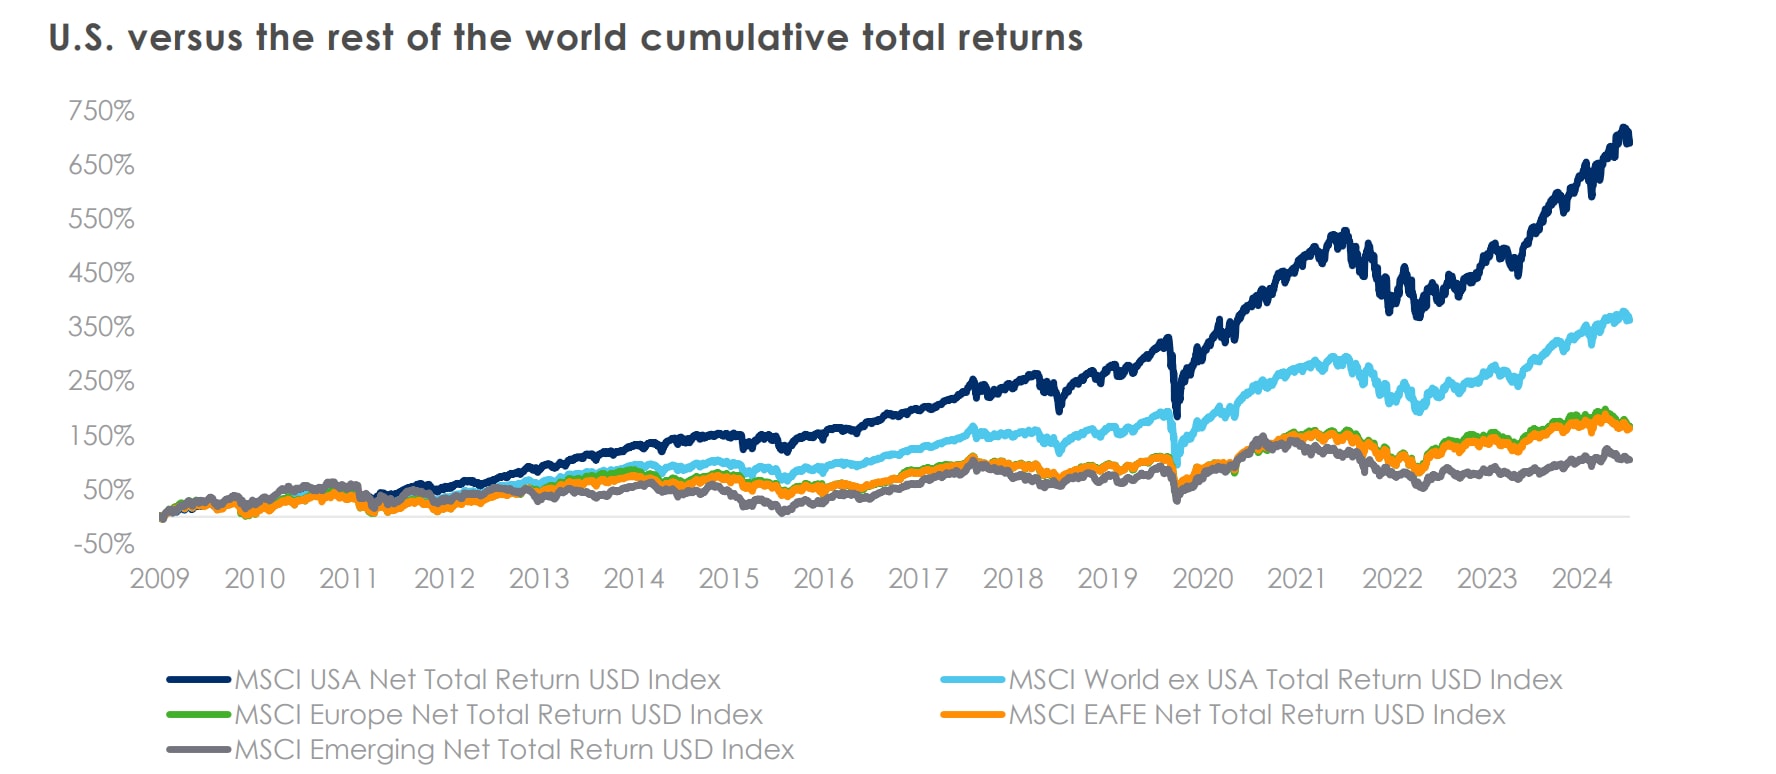
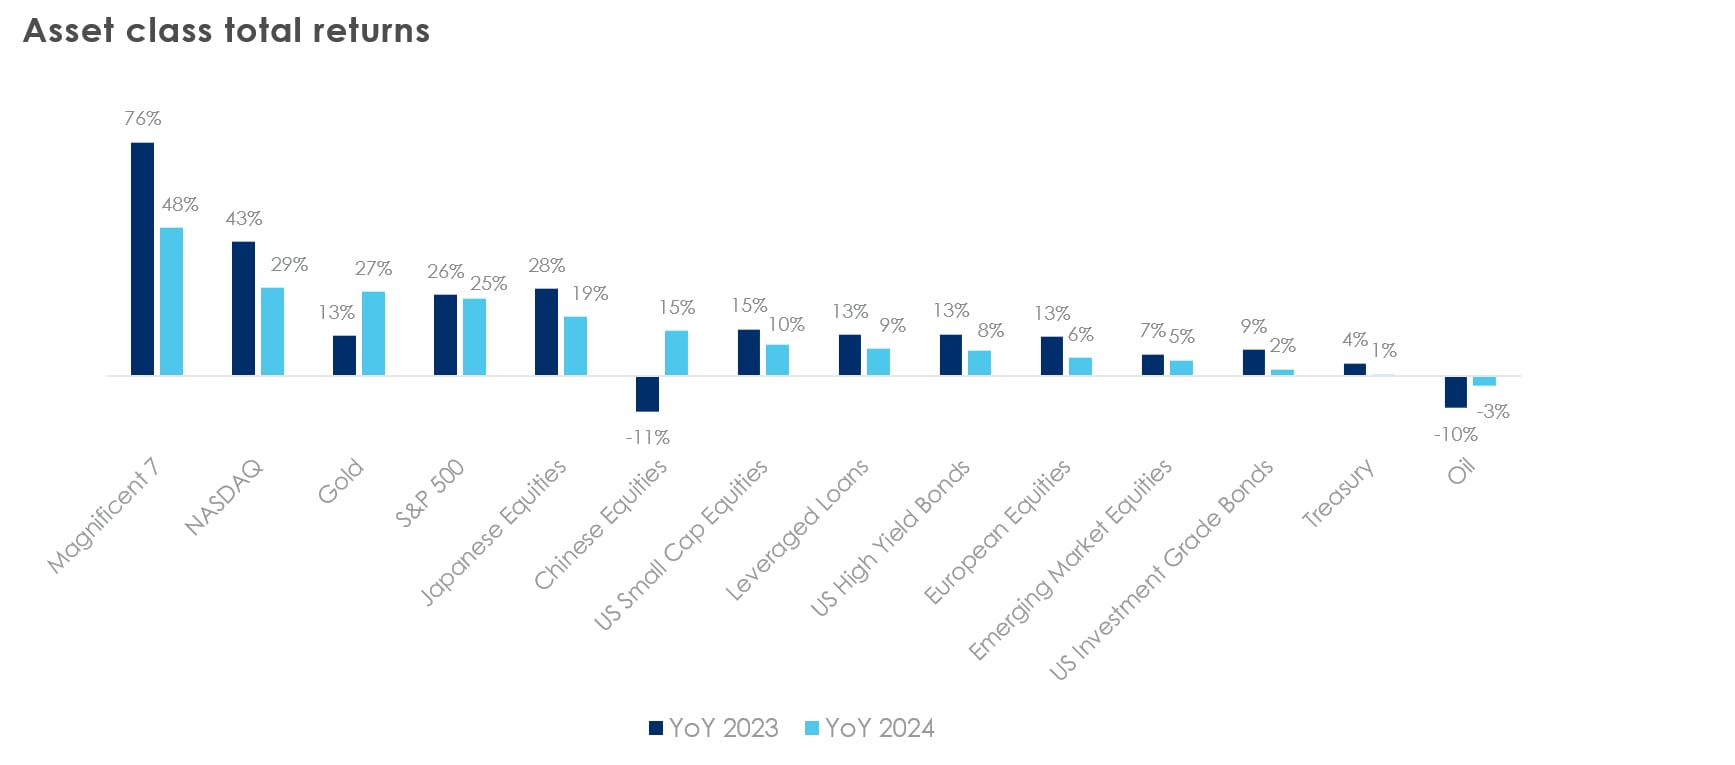
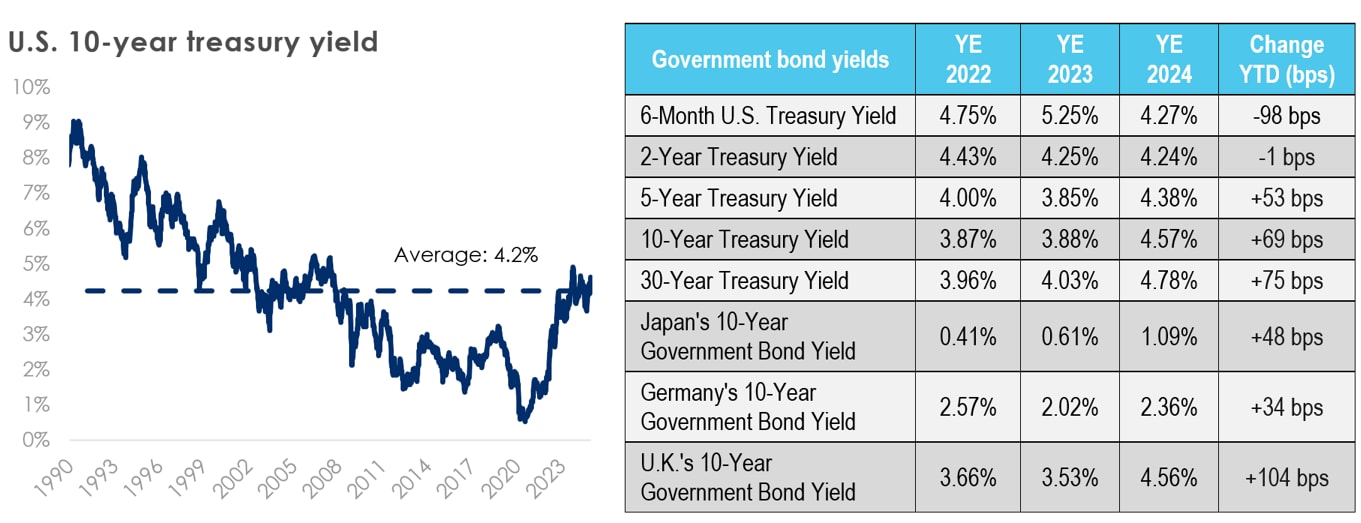
However, 2024 topped consensus expectations. Despite inflation remaining stickier and monetary policy staying restrictive, corporate earnings grew at a healthy pace, consumers showed resilience, the labor market remained relatively strong, and risk assets outperformed. “U.S. exceptionalism” was a prominent theme as both the U.S. economy and stock market once again outperformed the developed world. The S&P 500 returned over 20 percent for a second consecutive year for the first time since 1998, propelled by the artificial intelligence chipmaker Nvidia, which returned 171 percent. Gold rose over 27 percent, marking its best year since 2010, while the cryptocurrency Bitcoin surged 122 percent. Meanwhile, the Treasury yield curve steepened as the 10-year U.S. Treasury yield rose 69 basis points to end 2024 at 4.57 percent despite the Federal Reserve commencing an interest rate cutting cycle.
As we enter 2025, several questions remain:
- Which policies will the Trump administration enact, and which impacts will they have?
- To what extent will the U.S. government’s growing deficit and debt impact Treasury markets?
- How will inflation trends evolve?
- How long can the U.S. economy continue to grow at an above trend pace?
- How will the Fed manage the delicate balance between employment and inflation pressures?
- Will AI continue to drive growth and financial markets, or will expectations regarding its speed and pervasiveness wane?
- Can the "Magnificent 7" continue to propel equity markets forward, or do further equity market returns require more broad-based gains?
Considering these questions, let us delve into how the year finished out and what the future might hold.
Source: Bloomberg and Bianco Research as of Dec. 31, 2024.
U.S. economy slows, but barely
From an economic perspective, where was consensus wrong in 2024?
To begin with, neither a recession nor material slowdown materialized. In fact, the probability of a recession has now dropped to 20 percent, the lowest level since the first quarter of 2022. Recession fears were rebuffed by robust GDP growth, which is projected to close out 2024 at 2.7 percent, significantly higher than the initial forecast of 1.3 percent and down only slightly from 2.9 percent growth in 2023. This strong economic performance endured despite higher interest rates and uncertainty going into a presidential election. So why did the economy outperform? As we have observed throughout the year, several less initially apparent factors have helped to drive performance. This includes less consumer and company susceptibility to higher interest rates, wage growth that outpaced inflation, household wealth that reached new records, increased immigration, substantial AI and infrastructure spending, productivity gains, and continued fiscal support.
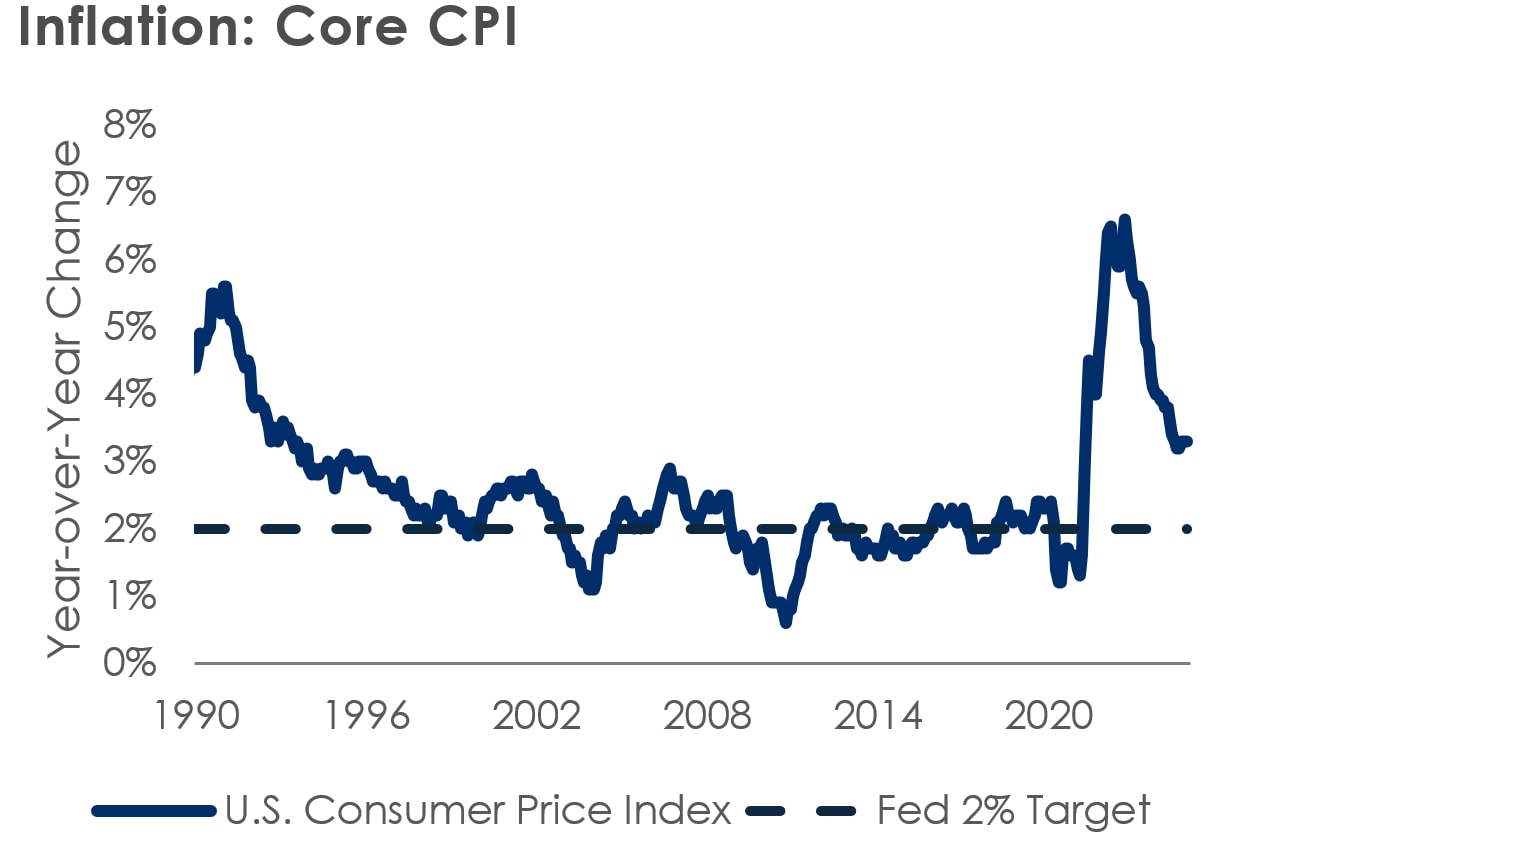
While there has been progress in bringing inflation down, it remains above the Fed’s 2 percent target and has eased more slowly than expected. Core CPI remains at 3.3 percent, down from 3.9 percent at the end of 2023. Furthermore, the robust U.S. economic performance provided the Fed with less justification to cut interest rates. Throughout much of the year, the balance of risks favored combating inflation, which postponed the start of the rate-cutting cycle and tamped down the absolute number of cuts perceived as necessary.
As we look ahead, the economic environment appears poised for significant change, introducing potential uncertainties and opportunities for the U.S. economy in 2025 and beyond. Notably, the new administration has prioritized immigration policy. Although the specifics remain uncertain, the general trend suggests a decline in net immigration, a reduction in labor supply, and a slowdown in population growth, which has been exceptionally high over the past five years. Additionally, the incoming administration is expected to reduce regulations and taxes, both widely viewed as positives for economic growth, efficiency, and corporate earnings. On the back of these policies, we could see increased merger and acquisition activity contribute to these tailwinds. Still, the sustainability of U.S. government debt, which has now eclipsed $36 trillion, remains a concern and constraint to the extent proposed tax policy could intensify this issue. Deficit spending, a key driver of growth in recent years, has reached potentially worrisome levels, with interest expense on debt now surpassing defense spending.
How these factors will ultimately converge remains uncertain, but we can anticipate some level of volatility along the way.
Source: Bloomberg as of Dec. 31, 2024.
Equities conclude record year as investor risk appetite remains strong
It follows that if the economy performed better than anticipated, risk assets likely reaped the benefits. The S&P 500 reached 57 all-time highs this year and achieved nearly a 25 percent total return. A significant contributor to this performance was the "Magnificent 7" — Microsoft, Amazon, Meta, Apple, Alphabet, Nvidia, and Tesla — which delivered a total market capitalization weighted return of almost 50 percent in 2024. Meanwhile, the equal-weighted S&P 500 index logged a total return of approximately 13 percent in 2024. The U.S. stock market value as a percentage of the global stock market continues to expand, reaching approximately 50 percent of global market capitalization.
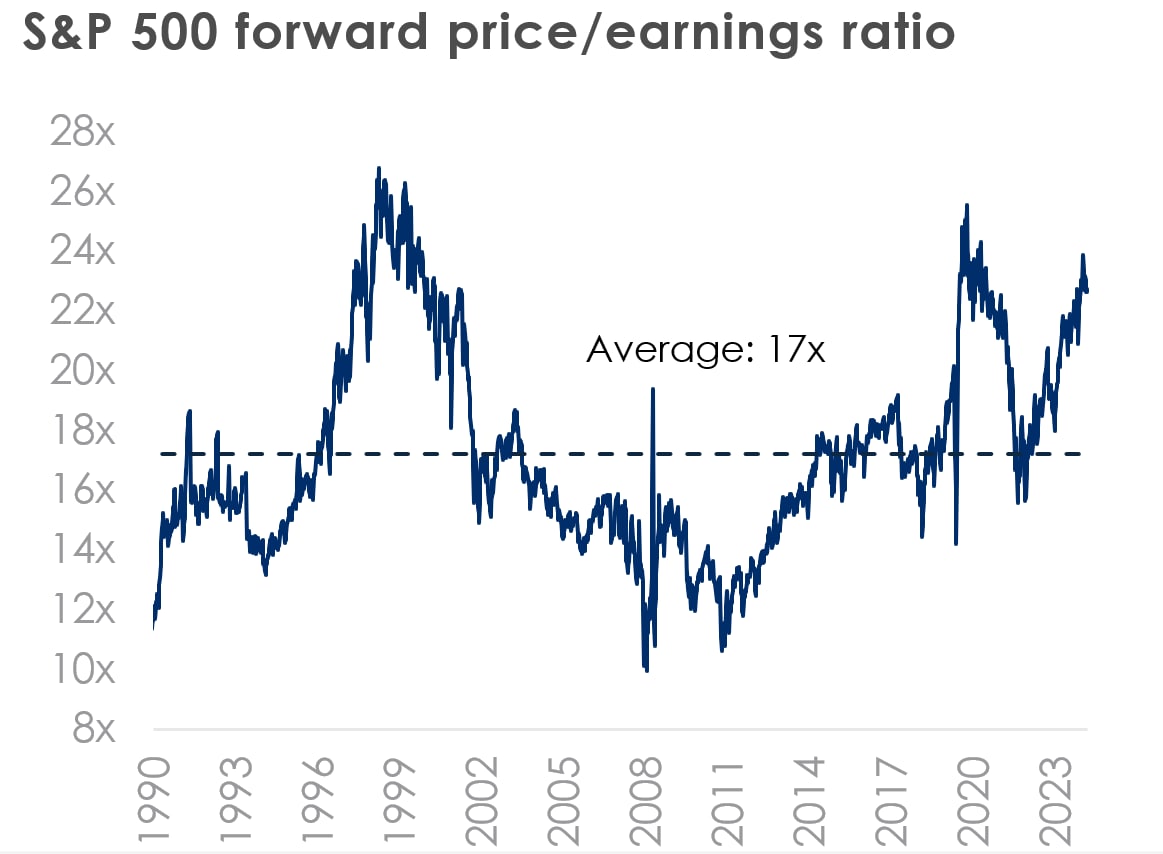
Nonetheless, the remarkable U.S. equity performance of 2024 raises questions about the sustainability of earnings growth and current valuation levels moving forward. S&P 500 earnings per share is forecast to have increased by approximately 8 percent in 2024 and are projected to rise by another 10 percent in 2025. Additionally, the forward price-to-earnings ratio stands at approximately 23x, significantly higher than the historical average of 17x since 2000.
Source: Bloomberg as of Dec. 31, 2024.
These elevated valuations are further exacerbated by concentration in a small cohort of stocks. The Magnificent 7's outperformance has led to their share of total S&P 500 market capitalization to increase significantly, now standing at almost 35 percent, up from around 10 percent a decade ago and roughly 20 percent five years ago. This rapid concentration and outperformance make the overall index heavily dependent on the Magnificent 7's performance in the future. Also, these stocks are highly correlated with each other and AI trends. Any negative shocks to AI, such as issues with runaway algorithms, litigation, slower development, or more cautious societal integration, could adversely affect the Magnificent 7 and disproportionately impact the overall index.
On a more positive note, the enthusiasm surrounding AI could be well-founded, and sentiment remains high as we head into the new year. First, numerous seminal economic theories and models suggest that technological progress is a key driver of sustained GDP growth. The advent and integration of AI across various industries and society may act as a catalyst for a significant increase in GDP growth. This implies that higher valuations could be warranted as future earnings growth rises.
Second, consumer sentiment, as measured by the University of Michigan, has been on an upward trajectory for five consecutive months leading into 2025. This trend indicates that consumers are more willing to spend, which bodes well for economic growth and corporate earnings in the future. This optimism is further evidenced by increased risk-taking behaviors, with retail investors significantly investing in Bitcoin and “memecoins.” Such actions reflect their higher risk tolerance, confidence in the future economy, and comfort with the current market environment.
In the investment-grade and high-yield corporate debt markets, credit spreads, a measure of the perceived relative riskiness of lending to a given company, have tightened significantly, now standing near their all-time tight levels at approximately 80 basis points and 287 basis points, respectively, indicating that investors see low levels of risk or stress in credit markets.
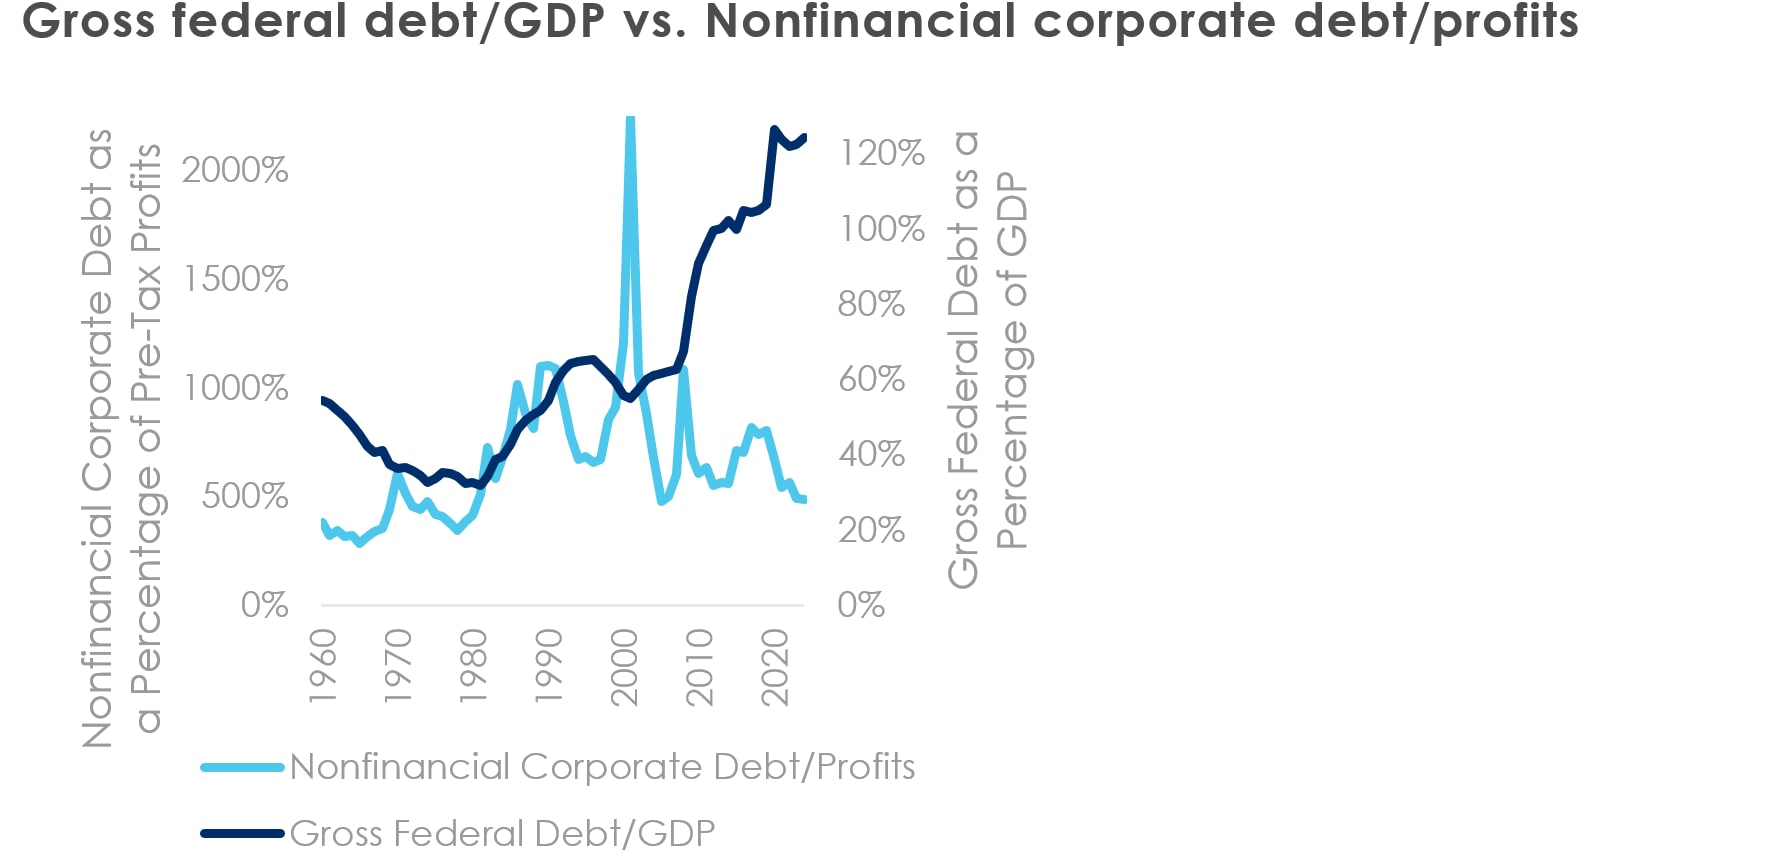
These tight levels are supported by both technical (supply and demand) and fundamental factors. On the technical front, higher overall yields driven by increased interest rates have spurred strong demand for corporate bonds and fixed income. Corporate credit fundamentals remain strong with a low level of defaults. There has also been a notable divergence between government and corporate debt levels. Specifically, Gross federal debt as a percentage of GDP has increased by approximately 17 percent over the past five years, whereas nonfinancial corporate debt as a percentage of pre-tax profits has decreased by approximately 40 percent during the same period.
Source: FRED as of June 28, 2024.
Fed forecasts shallower path of interest rate cuts
At the beginning of the year, the consensus was that the interest rate-cutting cycle would commence in March with a total of six cuts (1.5 percent total) throughout 2024. However, reality diverged from these expectations: we only saw four 25 basis point reductions (1.0 percent total), with two in September, one in November, and one in December. Now, as we look towards 2025, the pressing question arises — will we witness a more aggressive rate-cutting approach, or will higher interest rates persist for an extended period?
There has been significant volatility in 2025 rate cut expectations over the past several months. At one point in September, futures markets were pricing in as many as five cuts, and the Fed's Dot Plot indicated as many as four cuts. The most notable development in the fourth quarter occurred during the Fed's December meeting, where the updated Dot Plot suggested only two cuts — a substantial and sudden shift in Fed expectations.
The altered pace was driven by a more resilient than expected economy and recent persistent inflation readings. The Fed’s Summary of Economic Projections corroborated this perspective, projecting that inflation would not return to 2 percent target levels until 2027.
While the Fed has reduced rates by 100 basis points since September, a relatively swift pace of cuts, from September through year end, 10-year rates increased by approximately 70 basis points. Mortgage rates have also increased considerably. How can this be explained? The answer lies in long-term inflation expectations, which have risen since September, as well as concerns about rapidly growing U.S. government debt. Could the Fed’s recent reductions in interest rates and/or the pro-growth policies of the new administration trigger another wave of inflation? Will the U.S. fiscal position continue to deteriorate, potentially increasing long-term Treasury yields in the future?
Source: Bloomberg as of Dec. 31, 2024.
Looking ahead
As we look ahead to 2025, questions about the impact of new policies on immigration, taxes, tariffs, and regulations on growth and asset performance will be at the forefront. While consensus expects U.S. GDP growth to slow in 2025, the year's expectations have risen to 2.1 percent, up from 1.7 percent at the beginning of the year and 1.9 percent around the time of the Presidential Election in November. This positive growth outlook is expected to continue to support risk assets, with Wall Street analysts forecasting a median close of 6,600 for the S&P 500 at the end of 2025, translating to an approximate 12 percent price return. This forecast hinges largely on estimated strategist top-down earnings per share growth of approximately 13.5 percent, suggesting only a modest downward valuation adjustment. On the corporate credit side, the combination of higher interest rates fueling demand, robust earnings forecasts, and manageable borrowing levels is anticipated to keep credit spread tight.
Source: Bloomberg as of Dec. 31, 2024.
While expected new policy impacts seem to be inducing optimism regarding growth, concerns about government debt levels remain justified. Although growth can help alleviate this issue, the situation is complicated by several factors. These include proposed tax policy, higher for longer interest rates leading to increased refinancing costs for debt that needs to be refinanced, ongoing deficit spending, and a significant portion of the budget already allocated to debt servicing. Together, these elements obscure the direction and intensity of financial stress.
The U.S. is facing nearly $3 trillion of debt maturing in 2025, which will likely require refinancing. This is compounded by an anticipated deficit of around $2 trillion that will need to be funded through additional borrowing. Such substantial borrowing at elevated interest rates is challenging for the federal budget.
However, if the past few years have imparted any lesson, it is that expectations can often be, and indeed frequently are, dreadfully wrong. We wish you a great 2025 and strongly encourage you to consult with a financial professional in navigating this complex financial landscape.
____________________________